empty
16.05.2022 10:29 AM
Tips for beginner traders in EUR/USD and GBP/USD on May 16, 2022

Details of the economic calendar from May 13

EU industrial production data showed a decline of 0.8%, with a forecast of -1.0%. Despite a slight discrepancy in indicators, the European currency remained under pressure due to the fact that previous indicators were revised for the worse.

Analysis of trading charts from May 13

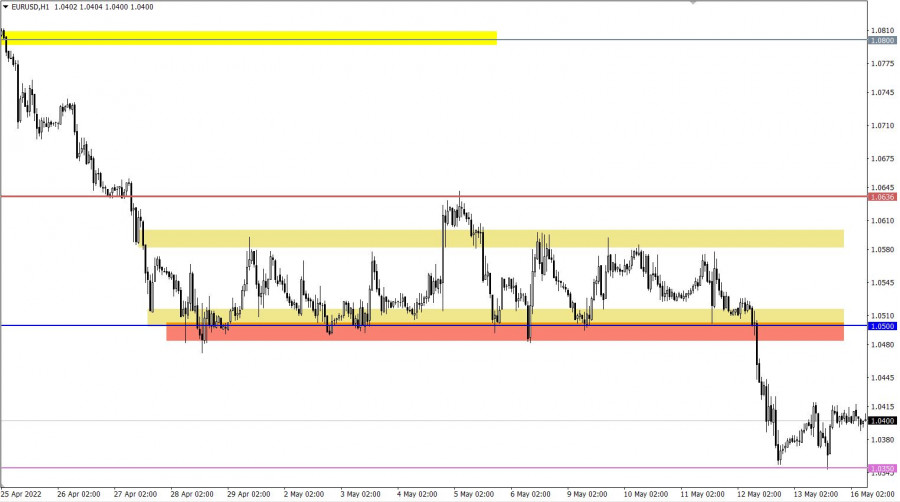
The EURUSD currency pair slowed down the downward move after the price approached the 2016 bottom. This led to a reduction in the volume of short positions and, as a result, a pullback of about 70 points.

On the trading chart of the daily period, there is an attempt to prolong the downward trend. In the future, this movement may lead to a breakdown of parity.

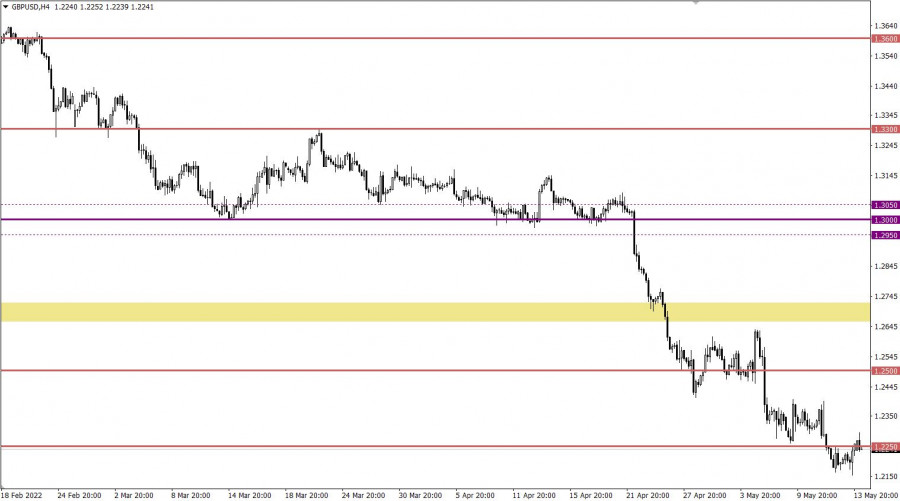
The GBPUSD currency pair, in the stage of a pullback from the variable pivot point of 1.2155, returned to the area of the level of 1.2250, where there was a slowdown. This step indicates the desire of sellers to resume the decline.

On the trading chart of the daily period, a gradual prolongation of the medium-term downward trend is observed.

This image is no longer relevant

Economic calendar for May 16

Monday is traditionally accompanied by a blank macroeconomic calendar. Nevertheless, stable information and news flow will continue to play on the nerves of speculators, which allows new jumps in the market.

Trading plan for EUR/USD on May 16

In this situation, the pullback was replaced by stagnation, where the values of 1.0350/1.0420 serve as variable boundaries of the amplitude. The optimal trading strategy is considered to be a breakdown of one or another stagnation border.

We concretize the above into trading signals:

Buy positions on the currency pair are taken into account after holding the price above the value of 1.0450 with the prospect of a move to 1.0500.

Sell positions should be considered after keeping the price below the local low of 2016, at 1.0325.

This image is no longer relevant

Trading plan for GBP/USD on May 16

Despite the slowdown, the pullback stage is still relevant in the market. In order for the downward cycle to resume, the quote must first return to the pivot point of 1.2150. This price move will indicate an increase in the volume of short positions, which will lead to the breakdown of the variable support and the trend prolongation.

An alternative market development scenario considers the price transition from the pullback stage to a full-scale correction. This movement can be indicated by a long stay of the price above 1.2250 in the daily period.

This image is no longer relevant

What is reflected in the trading charts?

A candlestick chart view is graphical rectangles of white and black light, with sticks on top and bottom. When analyzing each candle in detail, you will see its characteristics of a relative period: the opening price, closing price, and maximum and minimum prices.

Horizontal levels are price coordinates, relative to which a stop or a price reversal may occur. These levels are called support and resistance in the market.

Circles and rectangles are highlighted examples where the price of the story unfolded. This color selection indicates horizontal lines that may put pressure on the quote in the future.

The up/down arrows are the reference points of the possible price direction in the future.

Gven Podolsky,
الخبير التحليلي لدى شركة إنستافوركس
© 2007-2025
حدد الإطار الزمني
5
د
15
د
30
د
1
س
4
ساعات
1
يوم
1
أسبوع
كسب عائد من تغيرات أسعار العملات المشفرة مع إنستافوركس.
قم بتحميل منصة التداول ميتاتريدر 4 وافتح أول صفقة.
  • Grand Choice
    Contest by
    InstaForex
    InstaForex always strives to help you
    fulfill your biggest dreams.
    انضم إلى المسابقة

المقالات الموصى بها

كيفية تداول زوج الجنيه الإسترليني/الدولار الأمريكي في 31 مارس؟ نصائح بسيطة وتحليل التداول للمبتدئين

تداول زوج الجنيه الإسترليني/الدولار الأمريكي بشكل جانبي يوم الجمعة، على عكس زوج اليورو/الدولار الأمريكي. وهذا أمر غريب إلى حد ما. لعدة أسابيع الآن، يتحرك الجنيه الإسترليني في نطاق مسطح بدون

Paolo Greco 03:21 2025-03-31 UTC+2

كيفية تداول زوج اليورو/الدولار الأمريكي في 31 مارس؟ نصائح بسيطة وتحليل التداول للمبتدئين

في يوم الجمعة، تداول زوج العملات اليورو/الدولار الأمريكي مرة أخرى بارتفاع. لا يمكننا القول إن الأحداث الاقتصادية الكلية بررت هذا التحرك. في هذه المرحلة، ليس من المستغرب أن ينخفض الدولار

Paolo Greco 03:21 2025-03-31 UTC+2

GBP/USD: خطة التداول للجلسة الأمريكية في 28 مارس (مراجعة تداولات الصباح)

في توقعاتي الصباحية، ركزت على مستوى 1.2964 وخططت لاتخاذ قرارات دخول السوق بناءً عليه. دعونا نلقي نظرة على الرسم البياني لمدة 5 دقائق ونحلل ما حدث. أدى الارتفاع والاختراق الكاذب

Miroslaw Bawulski 18:54 2025-03-28 UTC+2

EUR/USD: خطة التداول للجلسة الأمريكية في 28 مارس (مراجعة التداولات الصباحية)

في توقعاتي الصباحية، قمت بتسليط الضوء على مستوى 1.0801 وخططت لتأسيس مداخل السوق الخاصة بي بناءً عليه. دعونا نلقي نظرة على الرسم البياني لمدة 5 دقائق لنرى ما حدث. الارتفاع

Miroslaw Bawulski 18:52 2025-03-28 UTC+2

كيفية تداول زوج الجنيه الإسترليني/الدولار الأمريكي في 28 مارس؟ نصائح بسيطة وتحليل التداول للمبتدئين

في يوم الخميس، ارتفع زوج الجنيه الإسترليني/الدولار الأمريكي أيضًا وبقوة ملحوظة. وعلى الرغم من صدور تقرير الناتج المحلي الإجمالي للربع الرابع في الولايات المتحدة بشكل معقول، إلا أنه لم يخفف

Paolo Greco 06:05 2025-03-28 UTC+2

كيفية تداول زوج اليورو/الدولار الأمريكي في 28 مارس؟ نصائح بسيطة وتحليل التداول للمبتدئين

ارتفع زوج العملات اليورو/الدولار الأمريكي إلى مستوى 1.0804 يوم الخميس. بطبيعة الحال، مثل هذا الارتفاع غير المتوقع والقوي نسبيًا في اليورو (أو بشكل أدق، انخفاض الدولار) لا يمكن أن يكون

Paolo Greco 06:05 2025-03-28 UTC+2

توصيات وتحليل التداول لزوج الجنيه الإسترليني/الدولار الأمريكي في 28 مارس: الجنيه يواصل التقلب

أظهر زوج العملات GBP/USD حركة صعودية قوية يوم الخميس. بطبيعة الحال، كان المحفز مرة أخرى هو دونالد ترامب، الذي فرض تعريفات جديدة بنسبة 25% على جميع واردات السيارات إلى الولايات

Paolo Greco 02:47 2025-03-28 UTC+2

توصيات وتحليل التداول لزوج اليورو/الدولار الأمريكي في 28 مارس: تعريفات ترامب والناتج المحلي الإجمالي

يوم الخميس، ارتفع زوج العملات EUR/USD بشكل حاد دون كسر الاتجاه الهبوطي السائد في الأيام الأخيرة. كانت هناك أسباب وجيهة ساهمت في تراجع الدولار بعد أن أعلن دونالد ترامب

Paolo Greco 02:47 2025-03-28 UTC+2

GBP/USD: خطة التداول للجلسة الأمريكية في 27 مارس (مراجعة التداولات الصباحية)

في توقعاتي الصباحية، ركزت على مستوى 1.2916 وخططت لاتخاذ قرارات التداول بناءً عليه. دعونا نلقي نظرة على الرسم البياني لمدة 5 دقائق ونرى ما حدث. قدم الاختراق وإعادة الاختبار لمستوى

Miroslaw Bawulski 17:56 2025-03-27 UTC+2

EUR/USD: خطة التداول للجلسة الأمريكية في 27 مارس (مراجعة التداولات الصباحية)

في توقعاتي الصباحية، ركزت على مستوى 1.0769 وخططت لاتخاذ قرارات التداول بناءً عليه. دعونا نلقي نظرة على الرسم البياني لمدة 5 دقائق ونرى ما حدث. انخفض الزوج وشكل اختراقًا كاذبًا

Miroslaw Bawulski 17:53 2025-03-27 UTC+2
لا تستطيع التحدث الآن؟
اطرح سؤالك في الدردشة.
Widget callback
 

Dear visitor,

Your IP address shows that you are currently located in the USA. If you are a resident of the United States, you are prohibited from using the services of InstaFintech Group including online trading, online transfers, deposit/withdrawal of funds, etc.

If you think you are seeing this message by mistake and your location is not the US, kindly proceed to the website. Otherwise, you must leave the website in order to comply with government restrictions.

Why does your IP address show your location as the USA?

  • - you are using a VPN provided by a hosting company based in the United States;
  • - your IP does not have proper WHOIS records;
  • - an error occurred in the WHOIS geolocation database.

Please confirm whether you are a US resident or not by clicking the relevant button below. If you choose the wrong option, being a US resident, you will not be able to open an account with InstaForex anyway.

We are sorry for any inconvenience caused by this message.