


signal strength 1 of 5
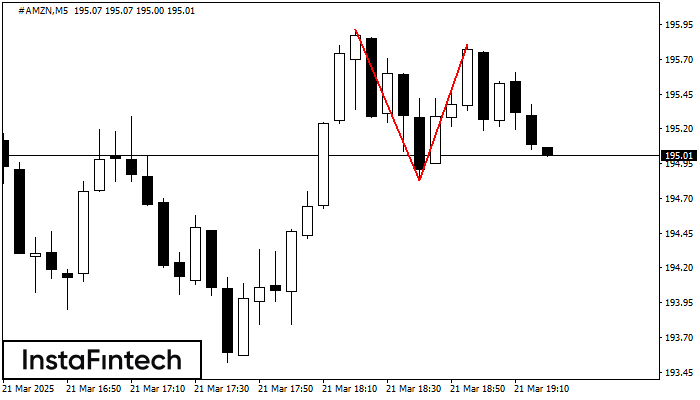
The Double Top reversal pattern has been formed on #AMZN M5. Characteristics: the upper boundary 195.92; the lower boundary 194.83; the width of the pattern is 98 points. Sell trades are better to be opened below the lower boundary 194.83 with a possible movements towards the 194.68 level.
The M5 and M15 time frames may have more false entry points.
انظر أيضا
- All
- Double Top
- Flag
- Head and Shoulders
- Pennant
- Rectangle
- Triangle
- Triple top
- All
- #AAPL
- #AMZN
- #Bitcoin
- #EBAY
- #FB
- #GOOG
- #INTC
- #KO
- #MA
- #MCD
- #MSFT
- #NTDOY
- #PEP
- #TSLA
- #TWTR
- AUDCAD
- AUDCHF
- AUDJPY
- AUDUSD
- EURCAD
- EURCHF
- EURGBP
- EURJPY
- EURNZD
- EURRUB
- EURUSD
- GBPAUD
- GBPCHF
- GBPJPY
- GBPUSD
- GOLD
- NZDCAD
- NZDCHF
- NZDJPY
- NZDUSD
- SILVER
- USDCAD
- USDCHF
- USDJPY
- USDRUB
- All
- M5
- M15
- M30
- H1
- D1
- All
- Buy
- Sale
- All
- 1
- 2
- 3
- 4
- 5
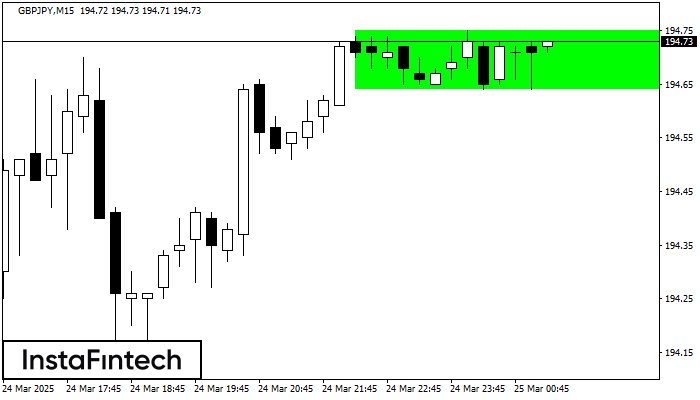
According to the chart of M15, GBPJPY formed the Bullish Rectangle. This type of a pattern indicates a trend continuation. It consists of two levels: resistance 194.75 and support 194.64
The M5 and M15 time frames may have more false entry points.
Open chart in a new window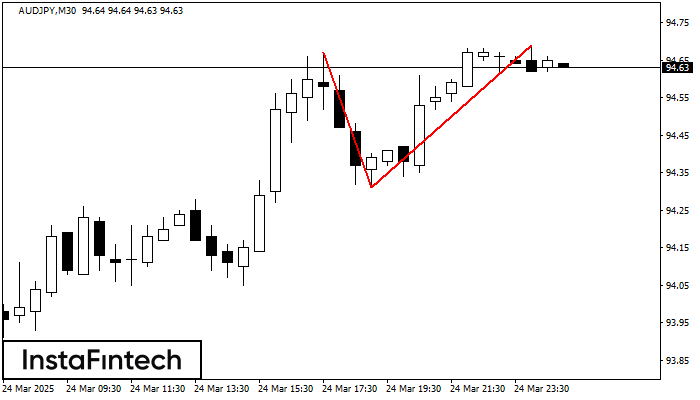
On the chart of AUDJPY M30 the Double Top reversal pattern has been formed. Characteristics: the upper boundary 94.69; the lower boundary 94.31; the width of the pattern 38 points
Open chart in a new window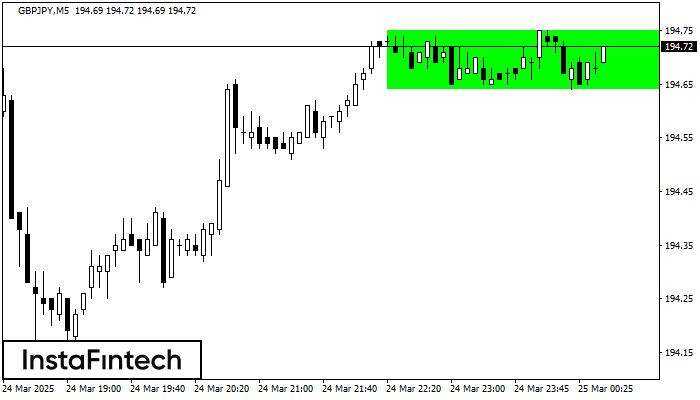
According to the chart of M5, GBPJPY formed the Bullish Rectangle. This type of a pattern indicates a trend continuation. It consists of two levels: resistance 194.75 and support 194.64
The M5 and M15 time frames may have more false entry points.
Open chart in a new window


