signal strength 2 of 5

The Bullish Flag pattern has been formed on GBPUSD at M15. The lower boundary of the pattern is located at 1.3255/1.3255, while the higher boundary lies at 1.3263/1.3263. The projection of the flagpole is 19 points. This formation signals that the upward trend is most likely to continue. Therefore, if the level of 1.3263 is broken, the price will move further upwards.
The M5 and M15 time frames may have more false entry points.
انظر أيضا
- All
- Double Top
- Flag
- Head and Shoulders
- Pennant
- Rectangle
- Triangle
- Triple top
- All
- #AAPL
- #AMZN
- #Bitcoin
- #EBAY
- #FB
- #GOOG
- #INTC
- #KO
- #MA
- #MCD
- #MSFT
- #NTDOY
- #PEP
- #TSLA
- #TWTR
- AUDCAD
- AUDCHF
- AUDJPY
- AUDUSD
- EURCAD
- EURCHF
- EURGBP
- EURJPY
- EURNZD
- EURRUB
- EURUSD
- GBPAUD
- GBPCHF
- GBPJPY
- GBPUSD
- GOLD
- NZDCAD
- NZDCHF
- NZDJPY
- NZDUSD
- SILVER
- USDCAD
- USDCHF
- USDJPY
- USDRUB
- All
- M5
- M15
- M30
- H1
- D1
- All
- Buy
- Sale
- All
- 1
- 2
- 3
- 4
- 5

The Double Bottom pattern has been formed on #FB D1. Characteristics: the support level 482.05; the resistance level 587.72; the width of the pattern 10567 points. If the resistance level
Open chart in a new window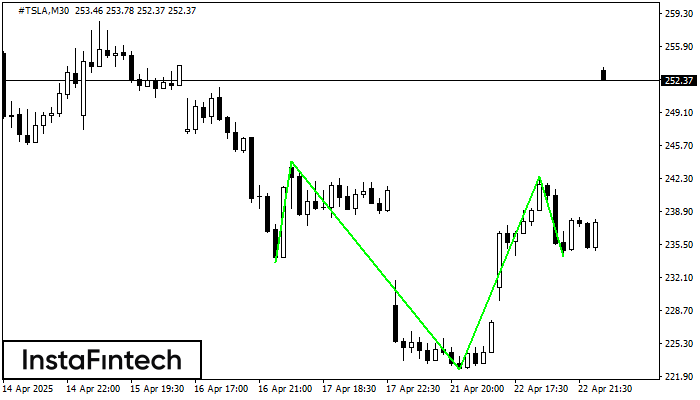
According to M30, #TSLA is shaping the technical pattern – the Inverse Head and Shoulder. In case the Neckline 244.08/242.52 is broken out, the instrument is likely to move toward
Open chart in a new window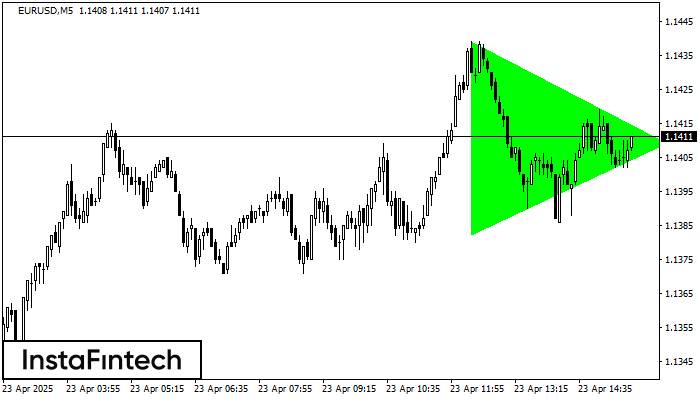
According to the chart of M5, EURUSD formed the Bullish Symmetrical Triangle pattern. The lower border of the pattern touches the coordinates 1.1382/1.1409 whereas the upper border goes across 1.1439/1.1409
The M5 and M15 time frames may have more false entry points.
Open chart in a new window