empty
22.02.2023 01:03 AM
Technical analysis of EUR/USD for February 21, 2023

This image is no longer relevant

Overview :

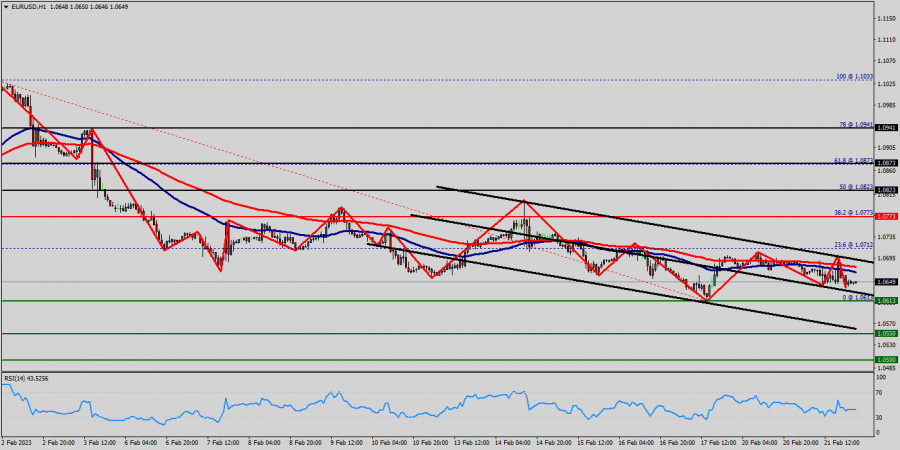
The EUR/USD pair continues to move downwards from the level of 1.0733. Yesterday, the pair dropped from the level of 1.0733 (this level of 1.0733 coincides with the double top - 38.2% of Fibonacci retracement levels) to the bottom around 1.0649. Today, the first resistance level is seen at 1.0712 followed by 1.0733 (the daily pivot point), while daily support 1 is found at 1.0613.

Also, the level of 1.0733 represents a weekly pivot point for that it is acting as major resistance/support this week. Amid the previous events, the pair is still in a downtrend, because the EUR/USD pair is trading in a bearish trend from the new resistance line of 1.0785 towards the first support level at 1.0670 in order to test it. If the pair succeeds to pass through the level of 1.0670, the market will indicate a bearish opportunity below the level of 1.0670.

So, we expect the price to set below the strong (first) support at the level of 1.0670; because the price is in a bearish channel now. The RSI starts signaling a downward trend. Consequently, the market is likely to show signs of a bearish trend. If the trend breaks the major support at 1.0670, the pair will move downwards continuing the bearish trend development to the level 1.0623 in order to test the daily support 2.

The EUR/USD pair is showing signs of strength following a breakout of the lowest level of 1.0550. The market is indicating a bearish opportunity above the above-mentioned support levels, for that the bearish outlook remains the same as long as the 100 EMA is headed to the downside. However, if a breakout happens at the resistance level of 1.0733, then this scenario may be invalidated.

টাইমফ্রেম নির্বাচন করুন
5
মিনিট
15
মিনিট
30
মিনিট
1
ঘন্টা
4
ঘন্টা
1
দিন
1
সপ্তাহ
ইনস্টাফরেক্স দিয়ে ক্রিপ্টোমুদ্রা দর পরিবর্তনে আয় করুন।
মেটাট্রেডার 4 ডাউনলোড করে আপনার প্রথম ট্রেড চালু করুন।
  • Grand Choice
    Contest by
    InstaForex
    InstaForex always strives to help you
    fulfill your biggest dreams.
    প্রতিযোগীতায় অংশগ্রহণ করুন

সুপারিশকৃত নিবন্ধ

স্বর্ণের (XAU/USD)–এর ট্রেডিং সিগন্যাল, ২৫–২৭ মার্চ, ২০২৫: মূল্য $3,024 (21 SMA - 7/8 মারে) এর ওপরে থাকা অবস্থায় স্বর্ণ কিনুন

মার্কিন সেশনের শুরুতে, স্বর্ণ $3,021 এর আশেপাশে ট্রেড করছে, যে লেভেলটি 21-SMA এর নিচে এবং ১৯ মার্চ থেকে গঠিত হওয়া বিয়ারিশ ট্রেন্ড চ্যানেলের মধ্যে অবস্থিত। H4 চার্টে আমরা দেখতে পাচ্ছি

Dimitrios Zappas 14:33 2025-03-25 UTC+2

স্বর্ণের (XAU/USD) ট্রেডিং সিগন্যাল – মার্চ ১৯-২১, ২০২৫: মূল্য $3,045 (+2/8 মারে + 21 SMA) এর নিচে থাকা অবস্থায় স্বর্ণ বিক্রির সুযোগ রয়েছে

মার্কিন সেশনের শুরুতে, গোল্ড $3,039 লেভেলের কাছাকাছি ট্রেড করছে, মূল্য +2/8 মারে লেভেলের নিচে অবস্থান করছে এবং ওভারবট লেভেলে পৌঁছেছে। প্রযুক্তিগতভাবে, স্বর্ণের তীব্র দরপতনের সম্ভাবনা রয়েছে। ইউরোপীয় সেশনে, স্বর্ণের মূল্য

Dimitrios Zappas 14:36 2025-03-19 UTC+2

স্বর্ণের (XAU/USD) ট্রেডিং সিগন্যাল, ৬-৮ মার্চ, ২০২৫: মূল্য $2,920 (21 SMA - 6/8 মারে) এর নিচে থাকা অবস্থায় স্বর্ণ বিক্রি করুন (২১ SMA - ৬/৮ মারে)

মার্কিন সেশনের শুরুতে, স্বর্ণ $2,904-এ ট্রেড করা হচ্ছি, যা ইউরোপিয়ান সেশনে 6/8 মারে ($2,889) টেস্ট করার পর পুনরুদ্ধার করেছে। আগামী কয়েক ঘণ্টার মধ্যে স্বর্ণের মূল্যের ঊর্ধ্বমুখী প্রবণতা বজায় থাকতে পারে

Dimitrios Zappas 15:06 2025-03-06 UTC+2

স্বর্ণের (XAU/USD) ট্রেডিং সিগন্যাল – ৪-৬ মার্চ, ২০২৫: মূল্য $2,908 (21 SMA - 61.8%) লেভেলের নিচে থাকা অবস্থায় স্বর্ণ বিক্রি করুন

টেকনিক্যালি, স্বর্ণের মূল্য ওভারবট লেভেলে পৌঁছেছে। তবে, আমরা ধারণা করছি যে টেকনিক্যাল কারেকশন আরও কিছু সময়ের জন্য চলতে পারে, যেখানে মূল্য $2,890 (6/8 মারে) এবং 21 SMA লেভেলের কাছাকাছি $2,880-এ

Dimitrios Zappas 07:51 2025-03-05 UTC+2

S&P 500 সূচকের পূর্বাভাস, ২৭ ফেব্রুয়ারি, ২০২৫

S&P 500 সূচকটি দীর্ঘ সময় ধরে অবস্থান ধরে রাখার চেষ্টা করেছিল, তবে শেষ পর্যন্ত এটি সাপ্তাহিক চার্টে পরিলক্ষিত ডাবল ডাইভারজেন্সের চাপ সহ্য করতে পারেনি। মার্লিন অসিলেটর ইতোমধ্যেই নেগেটিভ টেরিটরিতে প্রবেশ

Laurie Bailey 06:32 2025-02-27 UTC+2

বিটকয়েনের পূর্বাভাস – ১২ ফেব্রুয়ারি, ২০২৫

দৈনিক চার্টে, বিটকয়েনের মূল্য ব্যালেন্স সূচক লাইনের (লাল রঙ দ্বারা চিহ্নিত মুভিং এভারেজ) উপরে উঠতে লড়াই করছে, যা নির্দেশ করে যে মার্কেটের ট্রেডাররা বিটকয়েন বিক্রির দিকে মনোযোগ দিচ্ছে। মার্লিন অসিলেটরের

Laurie Bailey 08:55 2025-02-12 UTC+2

তেলের পূর্বাভাস - ১০ ফেব্রুয়ারি ২০২৫

সাপ্তাহিক চার্টে, মূল্য সাময়িকভাবে MACD সূচকের লাইনটির নিচে নেমে গিয়েছিল, তবে দ্রুতই পুনরুদ্ধার ঘটেছে। নতুন সপ্তাহের শুরুতে মূল্য এই লাইনের উপরে থাকা অবস্থায় ট্রেডিং শুরু হয়েছে, এবং এখন মূল্য 71.44

Laurie Bailey 07:03 2025-02-10 UTC+2

গোল্ডের (XAU/USD) ট্রেডিং সিগন্যাল, ২৯-৩১ জানুয়ারি, ২০২৫: গোল্ডের মূল্য $2,765 (21 SMA - 7/8 মারে)-এর নিচে থাকা অবস্থায় এটি বিক্রি করুন

মার্কিন সেশনের শুরুতে, গোল্ড $2,758 এর আশেপাশে ট্রেড করছে, যা 7/8 মারে-এর নিচে এবং জানুয়ারির শুরু থেকে গঠিত আপট্রেন্ড চ্যানেলের মধ্যে রয়েছে। গোল্ডের দরপতনের লক্ষণ দেখা যাচ্ছে। তাই, পরবর্তী কয়েক

Dimitrios Zappas 14:25 2025-01-29 UTC+2

EUR/USD-এর পূর্বাভাস, ২৯ জানুয়ারি, ২০২৫

গতকালকের সেশনের শেষের দিকে, EUR/USD পেয়ারের মূল্য দৈনিক চার্টে ব্যালেন্স ইন্ডিকেটর লাইনের নিচে নেমে গেছে। এটি এই ইঙ্গিত দেয় যে 1.0520 লেভেলের দিকে মূল্য বৃদ্ধি হয়তো একটি ভুল ব্রেকআউট ছিল

Laurie Bailey 07:29 2025-01-29 UTC+2

GBP/USD-এর পূর্বাভাস, ২৯ জানুয়ারি, ২০২৫

গতকাল ব্রিটিশ পাউন্ডের 55 পিপস দরপতন হয়েছে এবং এটির মূল্য দৈনিক MACD লাইনের (নীল লাইন) নিচে স্থিতিশীল হয়েছে। এখন মূল্য 1.2367 এর সাপোর্ট লেভেল টেস্ট করার প্রস্তুতি নিচ্ছে। আজ FOMC-এর

Laurie Bailey 07:23 2025-01-29 UTC+2
এখন কথা বলতে পারবেন না?
আপনার প্রশ্ন জিজ্ঞাসা করুন চ্যাট.
Widget callback
 

Dear visitor,

Your IP address shows that you are currently located in the USA. If you are a resident of the United States, you are prohibited from using the services of InstaFintech Group including online trading, online transfers, deposit/withdrawal of funds, etc.

If you think you are seeing this message by mistake and your location is not the US, kindly proceed to the website. Otherwise, you must leave the website in order to comply with government restrictions.

Why does your IP address show your location as the USA?

  • - you are using a VPN provided by a hosting company based in the United States;
  • - your IP does not have proper WHOIS records;
  • - an error occurred in the WHOIS geolocation database.

Please confirm whether you are a US resident or not by clicking the relevant button below. If you choose the wrong option, being a US resident, you will not be able to open an account with InstaForex anyway.

We are sorry for any inconvenience caused by this message.