

signal strength 1 of 5
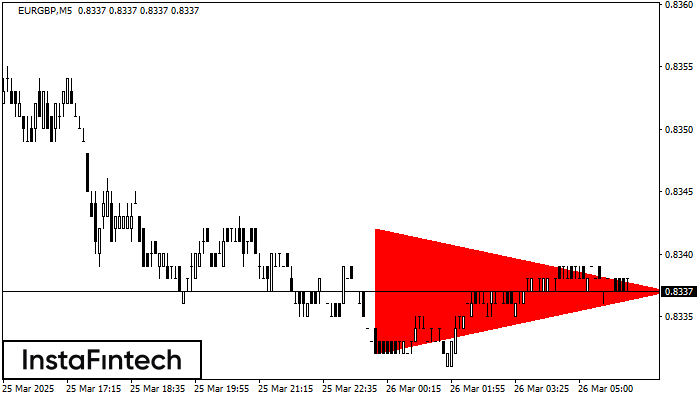
According to the chart of M5, EURGBP formed the Bearish Symmetrical Triangle pattern. Description: The lower border is 0.8332/0.8337 and upper border is 0.8342/0.8337. The pattern width is measured on the chart at -10 pips. The formation of the Bearish Symmetrical Triangle pattern evidently signals a continuation of the downward trend. In other words, if the scenario comes true and EURGBP breaches the lower border, the price could continue its move toward 0.8322.
The M5 and M15 time frames may have more false entry points.
আরও দেখুন
- All
- Double Top
- Flag
- Head and Shoulders
- Pennant
- Rectangle
- Triangle
- Triple top
- All
- #AAPL
- #AMZN
- #Bitcoin
- #EBAY
- #FB
- #GOOG
- #INTC
- #KO
- #MA
- #MCD
- #MSFT
- #NTDOY
- #PEP
- #TSLA
- #TWTR
- AUDCAD
- AUDCHF
- AUDJPY
- AUDUSD
- EURCAD
- EURCHF
- EURGBP
- EURJPY
- EURNZD
- EURRUB
- EURUSD
- GBPAUD
- GBPCHF
- GBPJPY
- GBPUSD
- GOLD
- NZDCAD
- NZDCHF
- NZDJPY
- NZDUSD
- SILVER
- USDCAD
- USDCHF
- USDJPY
- USDRUB
- All
- M5
- M15
- M30
- H1
- D1
- All
- Buy
- Sale
- All
- 1
- 2
- 3
- 4
- 5

According to the chart of M30, EURCHF formed the Inverse Head and Shoulder pattern. The Head’s top is set at 0.9269 while the median line of the Neck is found
Open chart in a new window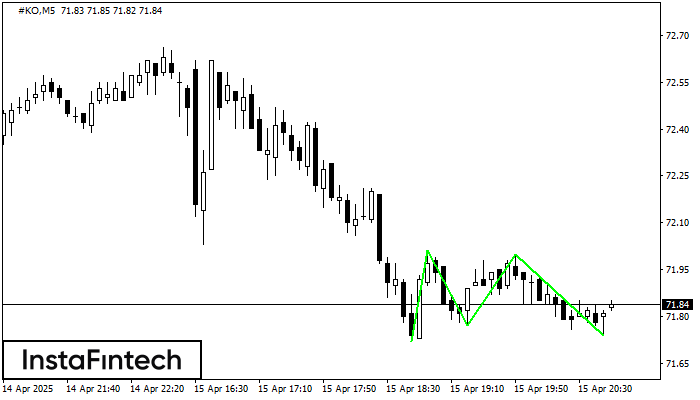
The Triple Bottom pattern has been formed on #KO M5. It has the following characteristics: resistance level 72.01/72.00; support level 71.72/71.74; the width is 29 points. In the event
The M5 and M15 time frames may have more false entry points.
Open chart in a new window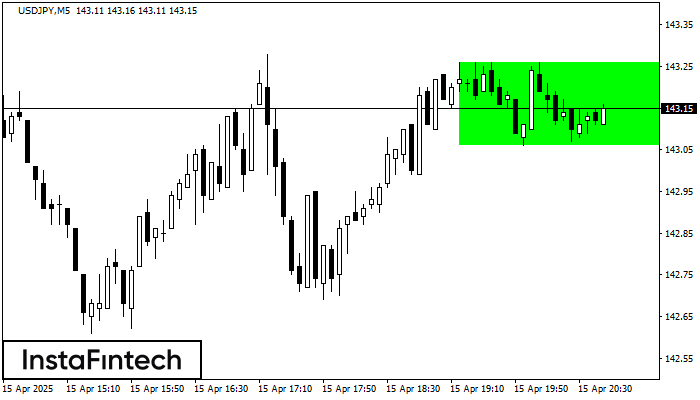
According to the chart of M5, USDJPY formed the Bullish Rectangle. This type of a pattern indicates a trend continuation. It consists of two levels: resistance 143.26 and support 143.06
The M5 and M15 time frames may have more false entry points.
Open chart in a new window


