Forecast for March 25:
Analysis of currency pairs on the H1 chart:
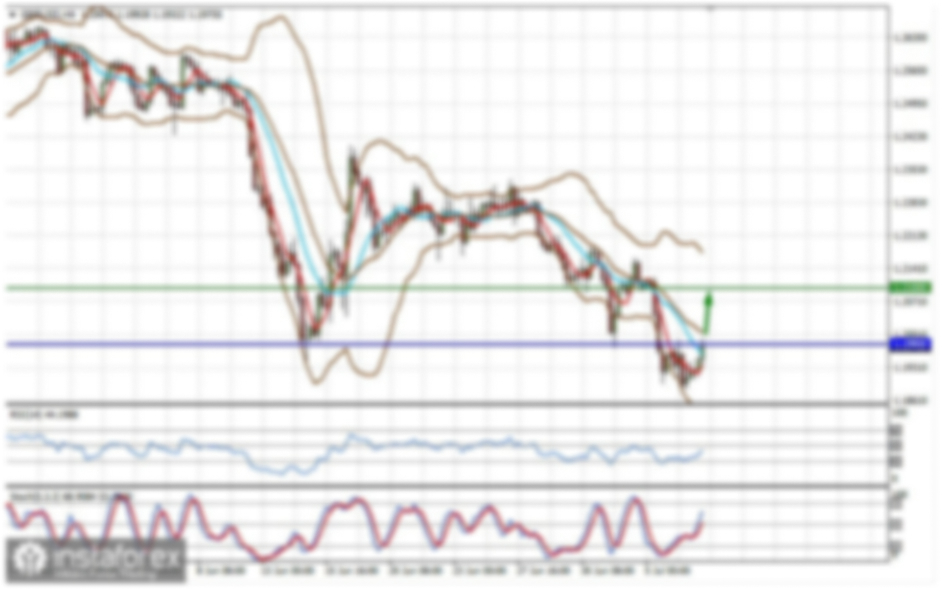
On the H1 chart, the key levels for the euro/dollar pair are 1.1924, 1.1893, 1.1869, 1.1836, 1.1812, 1.1766, 1.1726, and 1.1709. We follow the development of the downward structure from March 18. The pair may consolidate in the area of 1.1836 – 1.1812. The breakdown of the 1.1812 level may trigger a downward movement. If so, the target level for the pair will be 1.1766. After approaching this level, the pair may consolidate near this level. If the quote reaches the level of 1.1709, it may consolidate in the area of 1.1726 -1.1709 or rise.
A short-term upward movement is possible in the 1.1869 – 1.1893 area. A breakdown of the last level will lead to the development of a deep correction with the potential target of 1.1924.
The main trend is the downward structure from March 18
Trading recommendations:
Buy: 1.1870 Take profit: 1.1891
Buy: 1.1894 Take profit: 1.1924
Sell: 1.1811 Take profit: 1.1770
Sell: 1.1764 Take profit: 1.1726
On the H1 chart, the key levels for the pound/dollar pair are 1.3807, 1.3766, 1.3740, 1.3670, 1.3647, 1.3592, and 1.3553. We follow the development of the downward structure from March 18. We expect a continuation of the downward movement after the pair passes the range of 1.3670-1.3647 with the potential target of 1.3592. The pair may find the bottom at 1.3553. If so, it will consolidate near this level, as well as it may reverse upwards.
The short-term upward movement we expect in the area 1.3740-1.3766. The breakdown of the last level will lead to a deep correction near the target level of 1.3807. This level is key support for the downward structure.
The main trend is the downward structure from March 18
Trading recommendations:
Buy: 1.3740 Take profit: 1.3764
Buy: 1.3767 Take profit: 1.3805
Sell: 1.3699 Take profit: 1.3670
Sell: 1.3645 Take profit: 1.3592
On the H1 chart, the key levels for the dollar/frank pair are 0.9454, 0.9406, 0.9390, 0.9363, 0.9324, 0.9302, and 0.9269. We follow the upward trend from March 17. We expect the continuation of the upward movement after the breakout of 0.9363. In this case, the target level may be 0.9390. The pair may consolidate in the area of 0.9390 – 0.9406. The potential bullish level is 0.9454. After reaching it, the pair may retreat.
A short-term upward movement is possible in the area of 0.9324-0.9302, the breakdown of the last level will lead to a deep correction, with the target level of 0.9269. This level is key support for upward movement.
The main trend is the upward movement from March 17
Trading recommendations:
Buy: 0.9363 Take profit: 0.9390
Buy: 0.9407 Take profit: 0.9454
Sell: 0.9324 Take profit: 0.9303
Sell: 0.9301 Take profit: 0.9270
On the H1 chart, the key levels for the dollar/yen pair are 109.97, 109.40, 108.56, 108.04, and 107.39. We follow the upward pattern from February 23. A short-term upward movement is possible in the area of 109.40 – 109.97. After reaching these levels, the pair may enter the correctional phase.
We expect a short-term downward movement in the area of 108.56-108.04. The breakdown of the last level may lead to a deep correction with the target level of 107.39. This level is key support for upward movement.
The main trend is the upward structure from February 23. A correctional movement looks likely.
Reading recommendations:
Buy: 109.40 Take profit: 109.95
Buy: Take profit:
Sell: 108.54 Take profit: 108.06
Sell: 108.02 Take profit: 107.40
On the H1 chart, the key levels for the CAD/USD pair are 1.2788, 1.2753, 1.2700, 1.2650, 1.26, 1.2561, 1.2529, and 1.2489. We follow the development of the ascending structure from March 18. We expect the continuation of the upward movement after the price passes the range of 1.2626-1.2650. In this case, the target level may be 1.2700. The pair may enter consolidate near this level. The breakdown of the level of 1.2700 may lead to the development of an upward movement to the target of 1.2753. The pair may rise to the level of 1.2788. After reaching it, it may pull back to the bottom
We expect a short-term downward movement in the 1.2561 – 1.2529 area. A breakdown of the last level may trigger a deep correction to the target of 1.2489. This level is key support for upward movement.
The main trend is the upward cycle starting on March 18
Trading recommendations:
Buy: 1.2650 Take profit: 1.2700
Buy: 1.2703 Take profit: 1.2752
Sell: 1.2560 Take profit: 1.2531
Sell: 1.2527 Take profit: 1.2490
On the H1 chart, the key levels for the AUD/USD pair are 0.7742, 0.7686, 0.7646, 0.7588, 0.7554, 0.7467, 0.7442, and 0.7378. We follow the development of the downward structure from March 18. We expect a continuation of the downward movement after the pair passes the range of 0.7588-0.7554. In this case, the target level is 0.7467. The pair may consolidate in the area of 0.7467 – 0.7442. The potential value for the bottom is the level of 0.7378. The pair may start moving in this direction after it breaks below 0.7441.
The short-term upward movement is possible in the 0.7646 – 0.7686 area. A breakdown of the last level will lead to a deep correction to the target of 0.7742. This level is key support for the bottom.
The main trend is the downward structure from March 18
Trading recommendations:
Buy: 0.7646 Take profit: 0.7685
Buy: 0.7887 Take profit: 0.7741
Sell: 0.7554 Take profit: 0.7468
Sell: 0.7441 Take profit: 0.7378
On the H1 chart, the key levels for the euro/yen pair are 129.54, 129.11, 128.87, 128.36, 128.01, 127.79, 127.31, and 127.09. We follow the development of the downward structure from March 18. The downward movement may start after the pair breaks below 128.36. It is likely to decline to the target of 128.01. It may consolidate in the 128.01 – 127.79 area. The breakdown of the 127.77 level will lead to the development of a downward movement to the target of 127.31. The potential value for the bottom may be the level of 127.09. When reaching it, the pair may rise.
We expect a short-term upward movement in the range of 128.87-129.11. The breakdown of the last level will lead to a deep correction to the target level of 129.54. This level is key support for the bottom.
The main trend is the downward structure from March 18
Trading recommendations:
Buy: 128.87 Take profit: 129.10
Buy: 129.13 Take profit: 129.52
Sell: 128.34 Take profit: 128.01
Sell: 127.77 Take profit: 127.35
On the H1 chart, the key levels for the pound/yen pair are 150.52, 149.75, 149.34, 148.35, 147.75, 147.33, and 146.43. We follow the development of the downward cycle from March 18. We expect the continuation of the downward movement after the breakdown of 148.35. In this case, the target level may be 147.75. The pair may consolidate in the 147.75 – 147.33 area. The potential value for the bottom may be the level of 146.43. After reaching it, the pair may consolidate, as well as reserve upwards.
We expect a short-term upward movement in the area of 149.34-149.75. The breakdown of the last level may lead to a deep correction to the target level of 150.52. This level is key support for the bottom.
The main trend is the downward structure from March 18
Trading recommendations:
Buy: 149.34 Take profit: 149.75
Buy: 149.80 Take profit: 150.36
Sell: 148.35 Take profit: 147.90
Sell: 147.33 Take profit: 146.45
If you have any questions about this analysis, you can ask them on the Forexdengi.com forum in the analysis section. Just find my articles written under the name of Alexey Almazov.