

signal strength 3 of 5
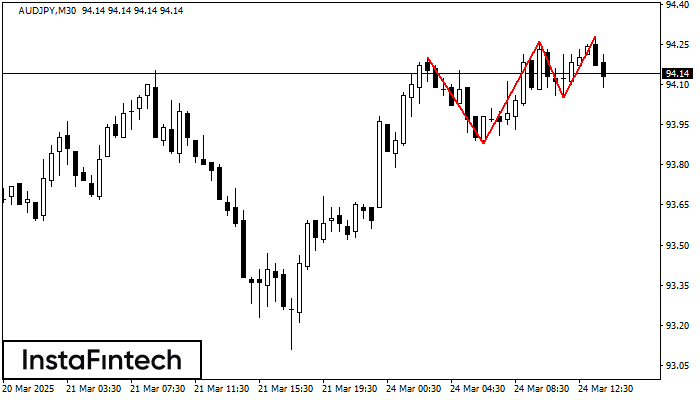
On the chart of the AUDJPY M30 trading instrument, the Triple Top pattern that signals a trend change has formed. It is possible that after formation of the third peak, the price will try to break through the resistance level 93.88, where we advise to open a trading position for sale. Take profit is the projection of the pattern’s width, which is 32 points.
- All
- Double Top
- Flag
- Head and Shoulders
- Pennant
- Rectangle
- Triangle
- Triple top
- All
- #AAPL
- #AMZN
- #Bitcoin
- #EBAY
- #FB
- #GOOG
- #INTC
- #KO
- #MA
- #MCD
- #MSFT
- #NTDOY
- #PEP
- #TSLA
- #TWTR
- AUDCAD
- AUDCHF
- AUDJPY
- AUDUSD
- EURCAD
- EURCHF
- EURGBP
- EURJPY
- EURNZD
- EURRUB
- EURUSD
- GBPAUD
- GBPCHF
- GBPJPY
- GBPUSD
- GOLD
- NZDCAD
- NZDCHF
- NZDJPY
- NZDUSD
- SILVER
- USDCAD
- USDCHF
- USDJPY
- USDRUB
- All
- M5
- M15
- M30
- H1
- D1
- All
- Buy
- Sale
- All
- 1
- 2
- 3
- 4
- 5
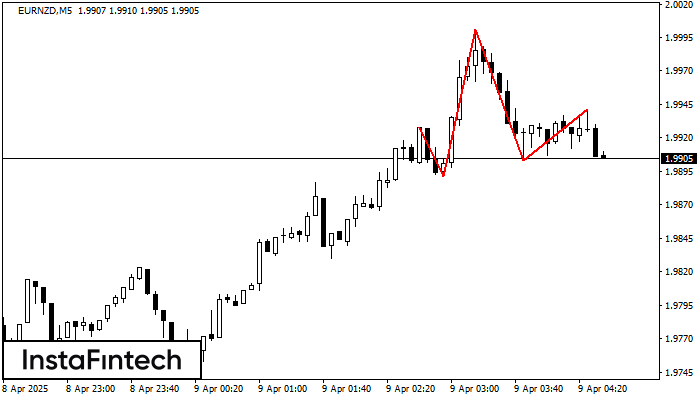
The technical pattern called Head and Shoulders has appeared on the chart of EURNZD M5. There are weighty reasons to suggest that the price will surpass the Neckline 1.9891/1.9903 after
The M5 and M15 time frames may have more false entry points.
Open chart in a new window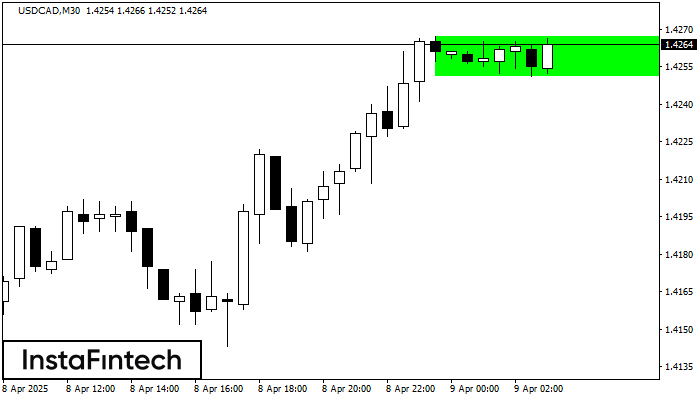
According to the chart of M30, USDCAD formed the Bullish Rectangle. The pattern indicates a trend continuation. The upper border is 1.4267, the lower border is 1.4251. The signal means
Open chart in a new window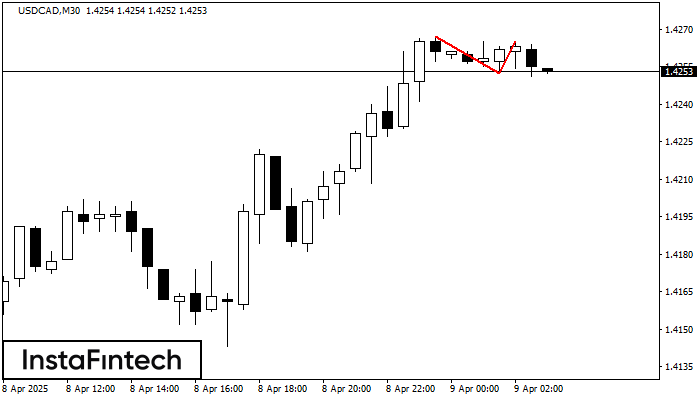
The Double Top pattern has been formed on USDCAD M30. It signals that the trend has been changed from upwards to downwards. Probably, if the base of the pattern 1.4252
Open chart in a new window


