

signal strength 1 of 5

The Double Bottom pattern has been formed on #Bitcoin M5. Characteristics: the support level 83619.16; the resistance level 83858.95; the width of the pattern 23979 points. If the resistance level is broken, a change in the trend can be predicted with the first target point lying at the distance of 23772 points.
The M5 and M15 time frames may have more false entry points.
See Also
- All
- Double Top
- Flag
- Head and Shoulders
- Pennant
- Rectangle
- Triangle
- Triple top
- All
- #AAPL
- #AMZN
- #Bitcoin
- #EBAY
- #FB
- #GOOG
- #INTC
- #KO
- #MA
- #MCD
- #MSFT
- #NTDOY
- #PEP
- #TSLA
- #TWTR
- AUDCAD
- AUDCHF
- AUDJPY
- AUDUSD
- EURCAD
- EURCHF
- EURGBP
- EURJPY
- EURNZD
- EURRUB
- EURUSD
- GBPAUD
- GBPCHF
- GBPJPY
- GBPUSD
- GOLD
- NZDCAD
- NZDCHF
- NZDJPY
- NZDUSD
- SILVER
- USDCAD
- USDCHF
- USDJPY
- USDRUB
- All
- M5
- M15
- M30
- H1
- D1
- All
- Buy
- Sale
- All
- 1
- 2
- 3
- 4
- 5
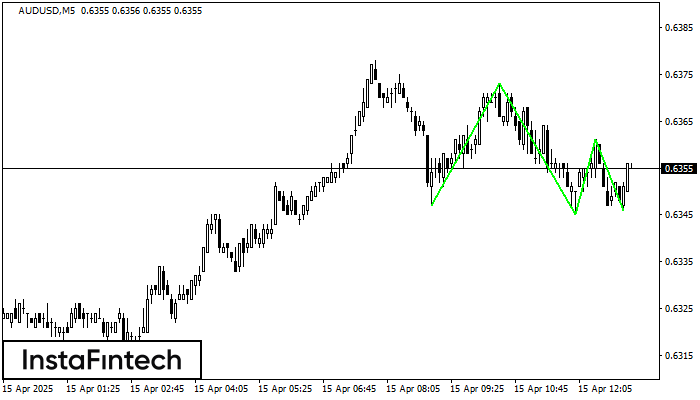
The Triple Bottom pattern has been formed on AUDUSD M5. It has the following characteristics: resistance level 0.6373/0.6361; support level 0.6347/0.6346; the width is 26 points. In the event
The M5 and M15 time frames may have more false entry points.
Open chart in a new window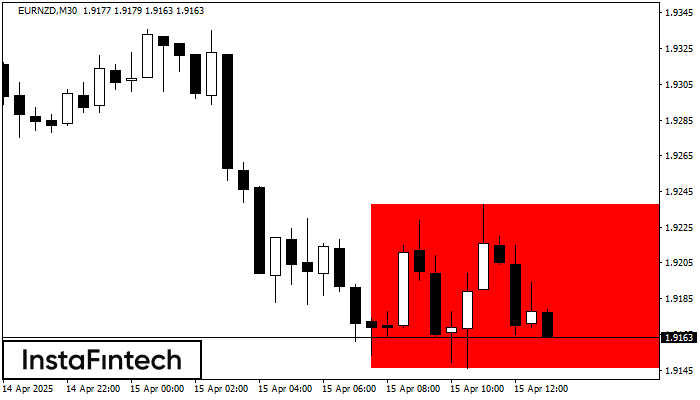
According to the chart of M30, EURNZD formed the Bearish Rectangle which is a pattern of a trend continuation. The pattern is contained within the following borders: lower border 1.9146
Open chart in a new window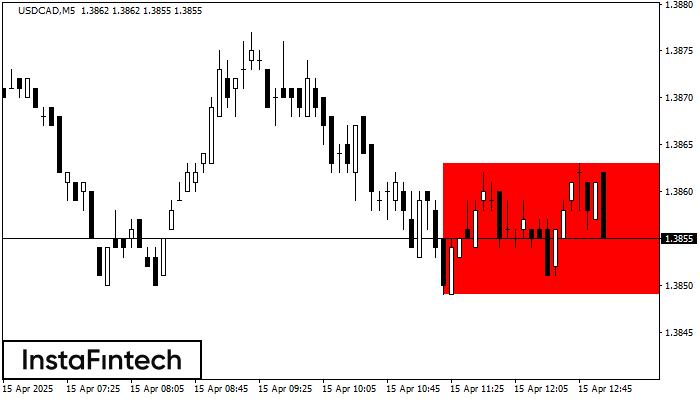
According to the chart of M5, USDCAD formed the Bearish Rectangle. The pattern indicates a trend continuation. The upper border is 1.3863, the lower border is 1.3849. The signal means
The M5 and M15 time frames may have more false entry points.
Open chart in a new window


