EUR/USD Analysis: Delving into German Retail Sales Disappointment
Key Takeaways:
- Unexpected Monthly Decline: January's German retail sales unexpectedly fell month-on-month, contradicting market expectations of growth.
- Annual Sales Drop: The year-on-year decline was more significant than anticipated, though it showed a slight improvement from December's figures.
- Limited Market Reaction: Despite the disappointing data, the impact on the EUR and the DE40 was minimal, indicating a possibly cautious market sentiment.
Fundamental Analysis: German Retail Sales in Focus
The release of the German retail sales report for January provides crucial insights into consumer behavior and economic health in Europe's largest economy. Typically, retail sales are a significant indicator of consumer spending, which contributes substantially to overall economic activity.
January's Retail Sales Overview
- Month-on-Month Analysis: The data revealed a 0.4% decline in retail sales from the previous month, contrary to the expected 0.5% increase. This unexpected drop, from a previously reported 1.6% decrease, suggests a weakening consumer confidence or possibly other external economic pressures affecting spending habits.
- Year-on-Year Perspective: Annually, the sales fell by 1.6%, a figure slightly worse than the anticipated 1.5% decrease but an improvement from the -1.7% reported in December. This indicates a persisting downward trend in consumer spending, albeit with a marginal amelioration.
Economic Implications
This report is pivotal for forex traders, as retail sales in a powerhouse economy like Germany can significantly influence the Eurozone's economic outlook. The data suggests that the German economy may be facing headwinds, potentially affecting the European Central Bank's (ECB) monetary policy decisions.
Market Reaction
The forex market's subdued reaction to the disappointing figures might indicate that investors had already priced in some degree of pessimism or that other global factors were at play, overshadowing the impact of the German data.
In the broader context, forex market analysts will be closely watching how this data interacts with other economic indicators and central bank policies to gauge the potential directions of the EUR and other correlated assets.
Looking Ahead
As forex market participants digest these figures, the focus will shift to upcoming economic releases and central bank statements to ascertain the broader implications for the Eurozone's economic health and monetary policy. This analysis will be crucial for traders looking to make informed decisions in a market that remains ever-responsive to fundamental economic indicators.
In conclusion, while the German retail sales report was a disappointment, the limited market reaction suggests a complex interplay of factors influencing forex markets, underscoring the importance of a multifaceted approach to fundamental analysis in forex trading.
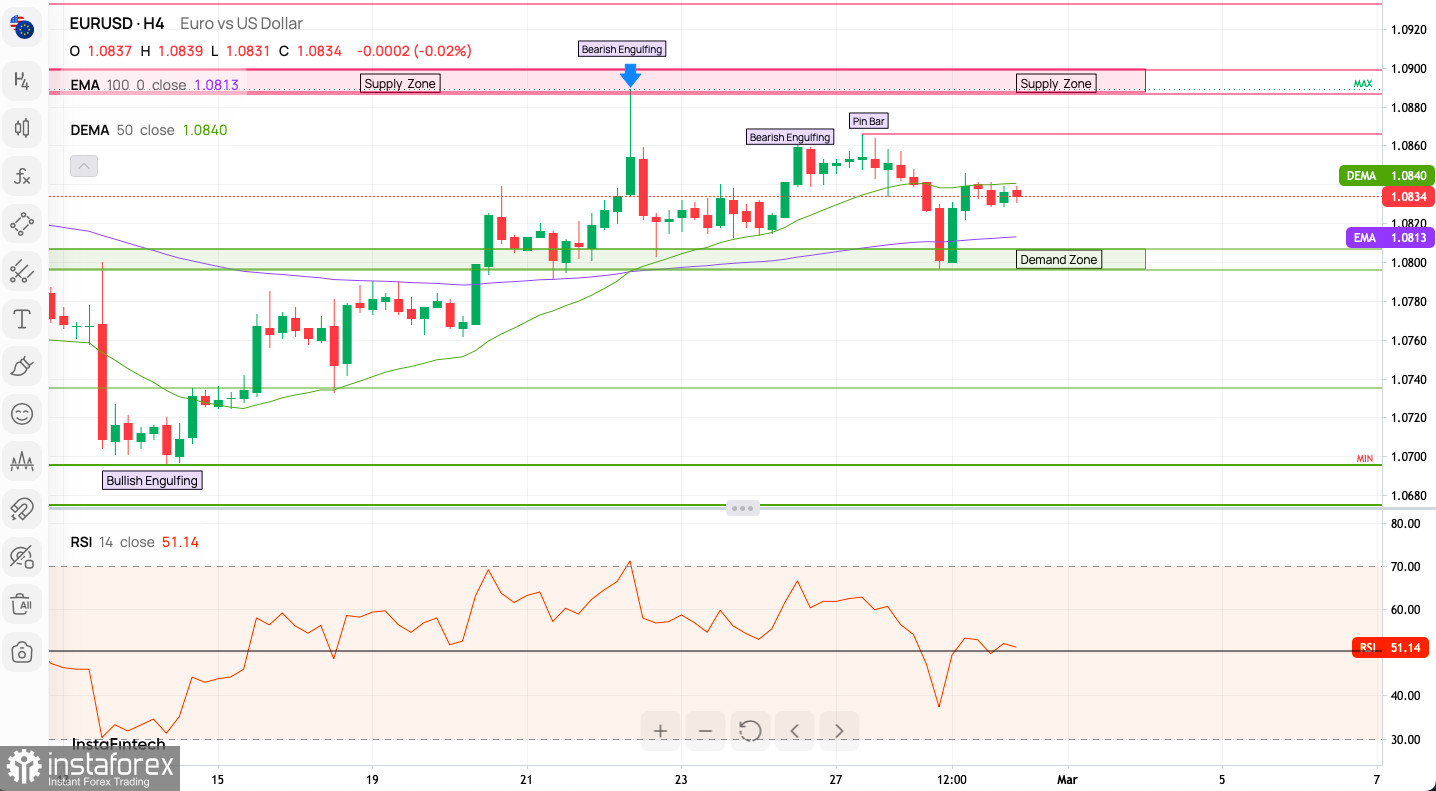
Technical Analysis Outlook:
Trend Analysis: The EUR/USD currency pair shows a sideways trend, with price action oscillating between the defined supply and demand zones. The horizontal movement suggests a consolidation phase following a previous uptrend, as indicated by the position of the price relative to the 100-period Exponential Moving Average (EMA) and the 50-period Double Exponential Moving Average (DEMA).
Candlestick Patterns: Notable candlestick patterns on the chart include a Bullish Engulfing pattern indicating a potential reversal of the downtrend at the lower bound of the price range. This is countered by Bearish Engulfing patterns and a Pin Bar near the supply zone, suggesting rejection at higher price levels.
Moving Averages: The price is currently hovering around the DEMA (1.0840) and just above the EMA (1.0813), reflecting a neutral to slightly bullish stance. However, the majority of moving averages indicate a sell signal, which could suggest that momentum may be shifting towards a bearish trend.
Indicators: The Relative Strength Index (RSI) is near the 51.14 level, which is slightly above the midpoint of 50. This indicates neither overbought nor oversold conditions, aligning with the market's consolidation narrative.
Sentiment Analysis: The sentiment is predominantly bullish based on the sentiment scoreboard, with a 60% bullish inclination. This suggests that the market participants are leaning towards an optimistic outlook for the euro against the dollar, though the sentiment from the last three days is neutral, reflecting the indecision in the market.
Weekly Pivot Points: The pivot points serve as potential levels of support and resistance. The current price is above the weekly pivot point (1.0803), indicating that the bullish sentiment has some grounding. However, resistance levels R1 (1.0824) and R2 (1.0871) might cap upward movements, while support levels S1 (1.0767) and S2 (1.0726) offer downside protection.
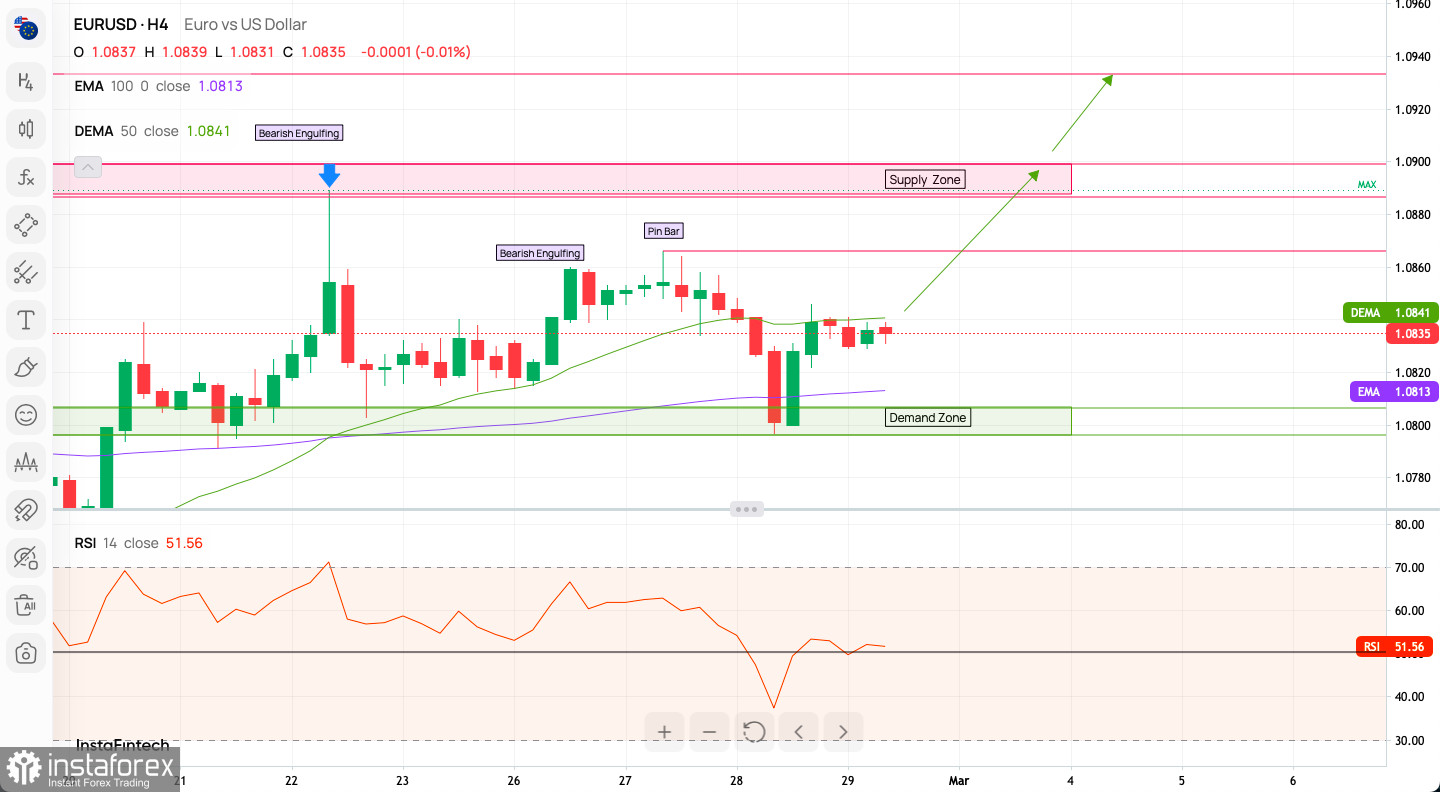
Bullish Scenario: Here are the elements that could contribute to a bullish scenario:
- The price sustains above the EMA and DEMA, and these moving averages turn into dynamic support levels.
- The RSI moves above the 60 level, indicating increasing bullish momentum.
- A series of higher highs and higher lows form, breaking past the current supply zone and the R1 pivot point (1.0824), aiming for the next resistance at R2 (1.0871).
- The sentiment shifts even more towards the bulls, potentially due to economic, geopolitical, or financial news that favors the Eurozone.
If these conditions are met, the bullish scenario would likely see the EUR/USD targeting the R2 level and, if momentum is strong, possibly extending gains towards the R3 (1.0935) pivot point, which would be the next significant resistance level.
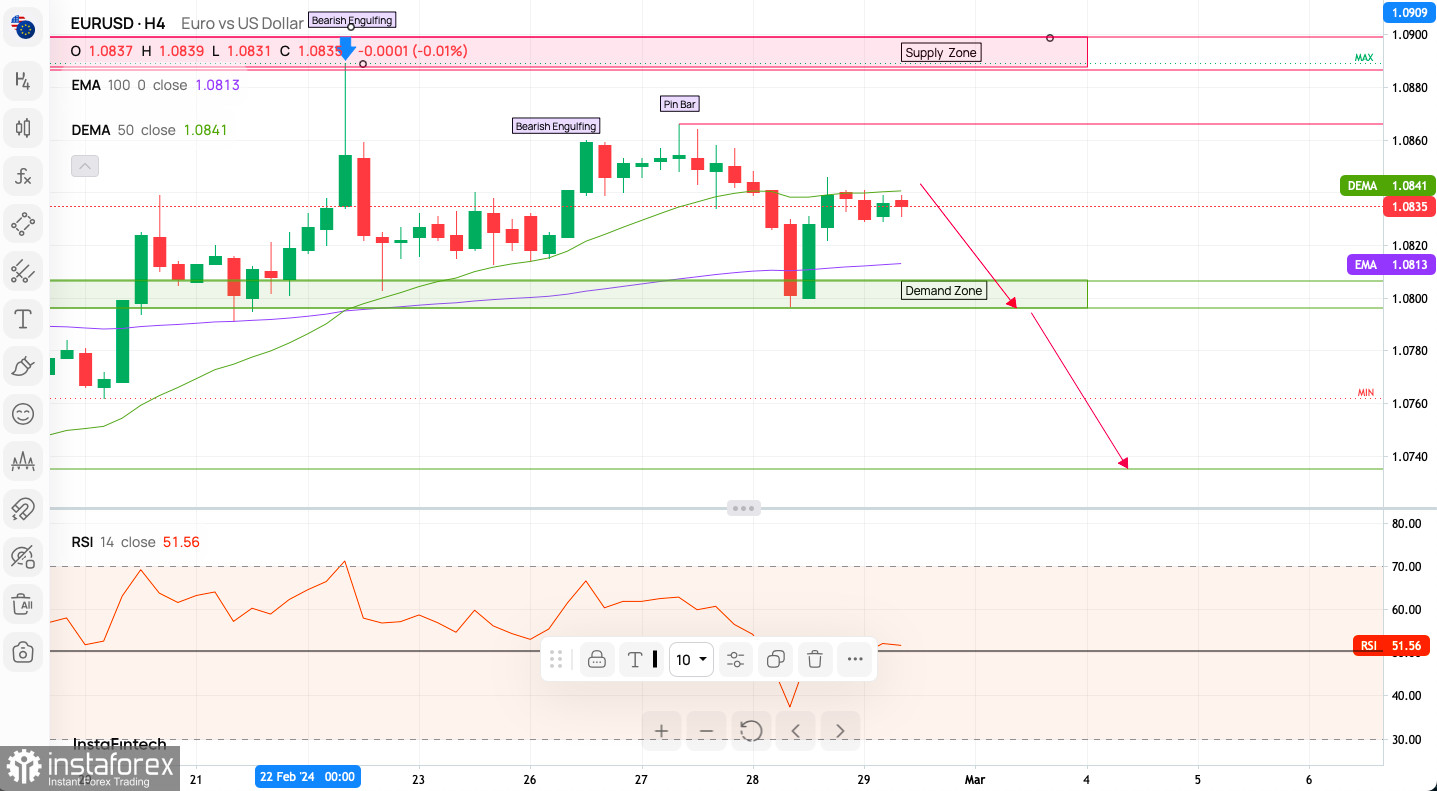
Bearish Scenario:
Conversely, in a bearish scenario, we would look for a rejection at the supply zone, indicating that sellers are returning to the market. This could be due to strengthening of the US Dollar or disappointing data from the Eurozone.
Characteristics of a bearish scenario might include:
- Failure to break above the supply zone, followed by a downward reversal pattern such as a bearish engulfing or a pin bar.
- The RSI declines below the 50 mark, suggesting growing bearish momentum.
- A breakdown below the current demand zone, with the price falling through the weekly pivot point (1.0803) and targeting support levels S1 (1.0767) and S2 (1.0726).
- A shift in sentiment to favor bears, possibly triggered by strong US economic performance or negative developments in the Eurozone.
In this bearish scenario, a sustained move below the pivot could see the EUR/USD pair targeting the S2 level, and if selling pressure intensifies, we could see a further descent towards the S3 (1.0690) support zone.
In both scenarios, traders should watch for confirmation signals in the form of candlestick patterns, RSI readings, and a shift in market sentiment. It's also important to pay close attention to upcoming economic events and releases that could significantly impact currency movements. As with any trading strategy, appropriate risk management measures should be in place to protect against market volatility.
Conclusion: The technical analysis of the EUR/USD H4 chart suggests a market in consolidation with a slight bullish bias. The indecision is evident from the mixed signals from candlestick patterns and moving averages. RSI indicates a neutral market, and the sentiment is slightly bullish but has neutralized in recent days. Traders might look for a decisive breakout from the supply or demand zone to confirm a directional move. It is essential for traders to monitor these levels, along with the RSI and sentiment shifts, for potential trading opportunities. As always, it is crucial to consider risk management strategies and be prepared for sudden changes in market conditions.
Useful Links
Important Notice
The begginers in forex trading need to be very careful when making decisions about entering the market. Before the release of important reports, it is best to stay out of the market to avoid being caught in sharp market fluctuations due to increased volatility. If you decide to trade during the news release, then always place stop orders to minimize losses.
Without placing stop orders, you can very quickly lose your entire deposit, especially if you do not use money management and trade large volumes. For successful trading, you need to have a clear trading plan and stay focues and disciplined. Spontaneous trading decision based on the current market situation is an inherently losing strategy for a scalper or daytrader.
#instaforex #analysis #sebastianseliga