EUR/USD 5-Minute Analysis
The EUR/USD currency pair traded with only minimal gains on Tuesday, but the overall trend on the hourly timeframe remains bearish following the price's exit from the ascending channel. The euro's decline is relatively weak, with frequent pullbacks, yet remains quite stable. Overall, we believe that the euro's downward movement is currently the most logical scenario, as the currency has appreciated significantly in recent weeks—something that is completely out of line with the macroeconomic and fundamental backdrop. Let us remind you that in recent weeks, the market has only been pricing in the "Trump factor," ignoring all other publications and events. As a result, the U.S. dollar has fallen far too much—and undeservedly so.
Unfortunately, the new tariffs that Donald Trump may announce as soon as next week could again trigger a decline in the dollar. It's extremely difficult to predict how long Trump alone will continue to dominate market sentiment. Still, we don't want traders to entertain the illusion that the current rise in the euro is justified. It's only justified if one ignores all events except the U.S. president's trade wars. Not even the United States as a whole—but specifically the president—since no one before Trump in recent decades has launched any "wars" or complained about "unfairness."
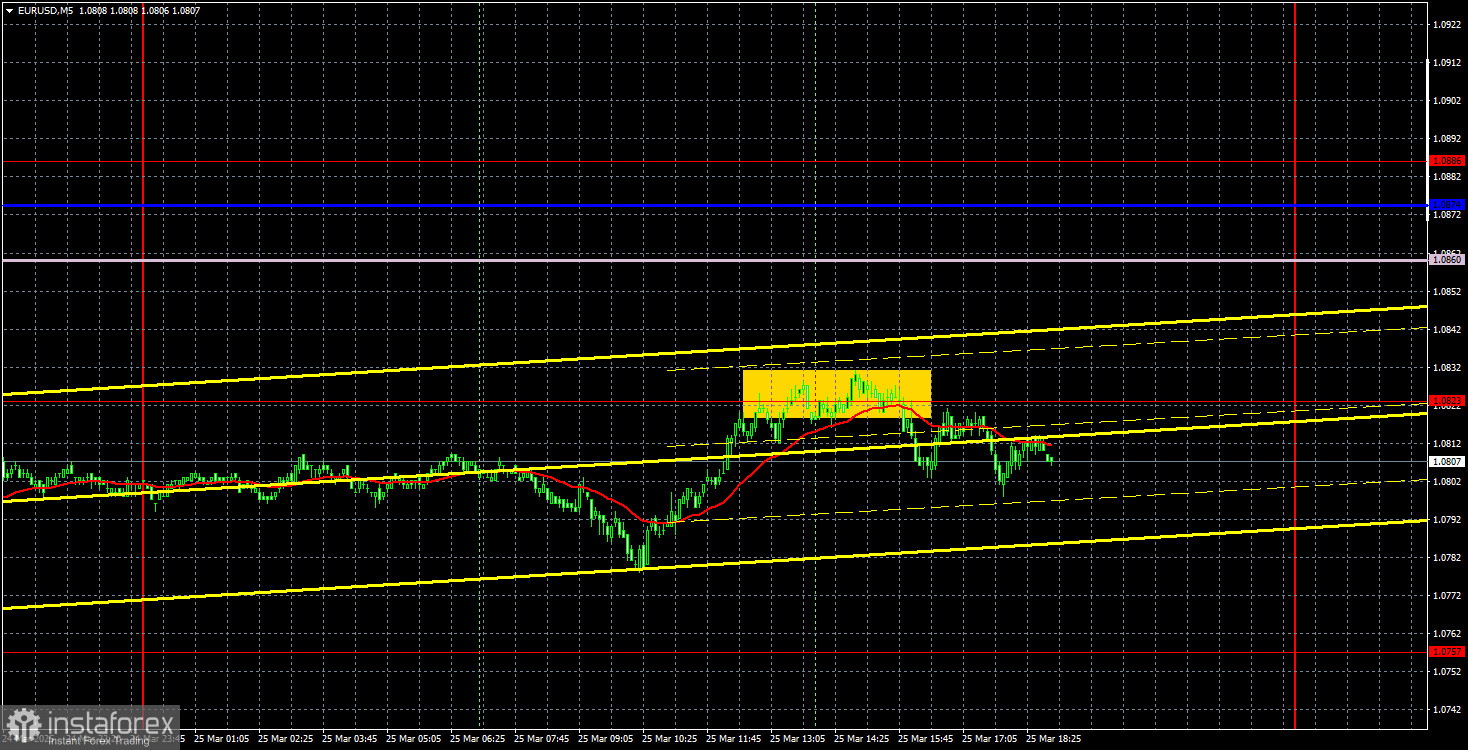
On the 5-minute chart, exactly one trading signal was formed yesterday—a sell signal. However, it was far from precise. For several hours, the price hovered indecisively around the 1.0823 level before finally bouncing off it in a very unconvincing manner. In our view, this trading signal was not worth acting upon. And the macroeconomic backdrop on Tuesday was practically nonexistent.
COT Report
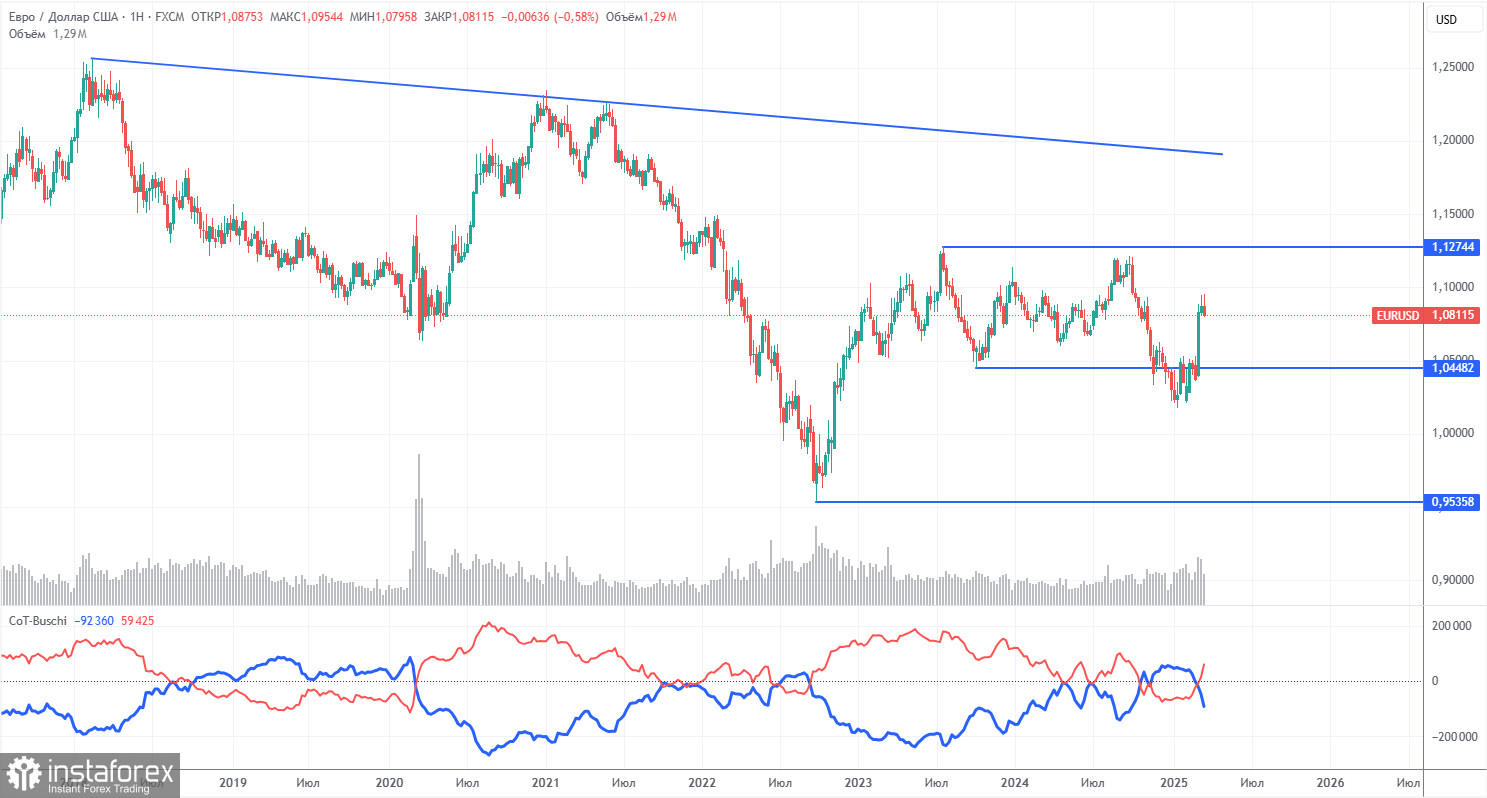
The latest Commitment of Traders (COT) report is dated March 18. As shown in the illustration, the net position of non-commercial traders remained bullish for a long time. The bears only recently gained a slight advantage, but now the bulls are back in control. Bearish positioning has quickly eroded since Trump assumed office and the dollar collapsed. We can't definitively say the dollar's decline will continue, and COT data reflects the sentiment of large players, which can shift rapidly in current conditions.
We still don't see any fundamental factors supporting euro strength, but there is now one powerful reason for dollar weakness. The pair may continue to correct for several weeks or months, but the 16-year downtrend won't reverse quickly.
Currently, the red and blue lines have crossed again, indicating a bullish trend. In the most recent reporting week, the number of long positions in the non-commercial group increased by 300 contracts, while the number of short positions fell by 46,000 contracts. As a result, the net position rose by 45,700 contracts.
EUR/USD 1-Hour Analysis
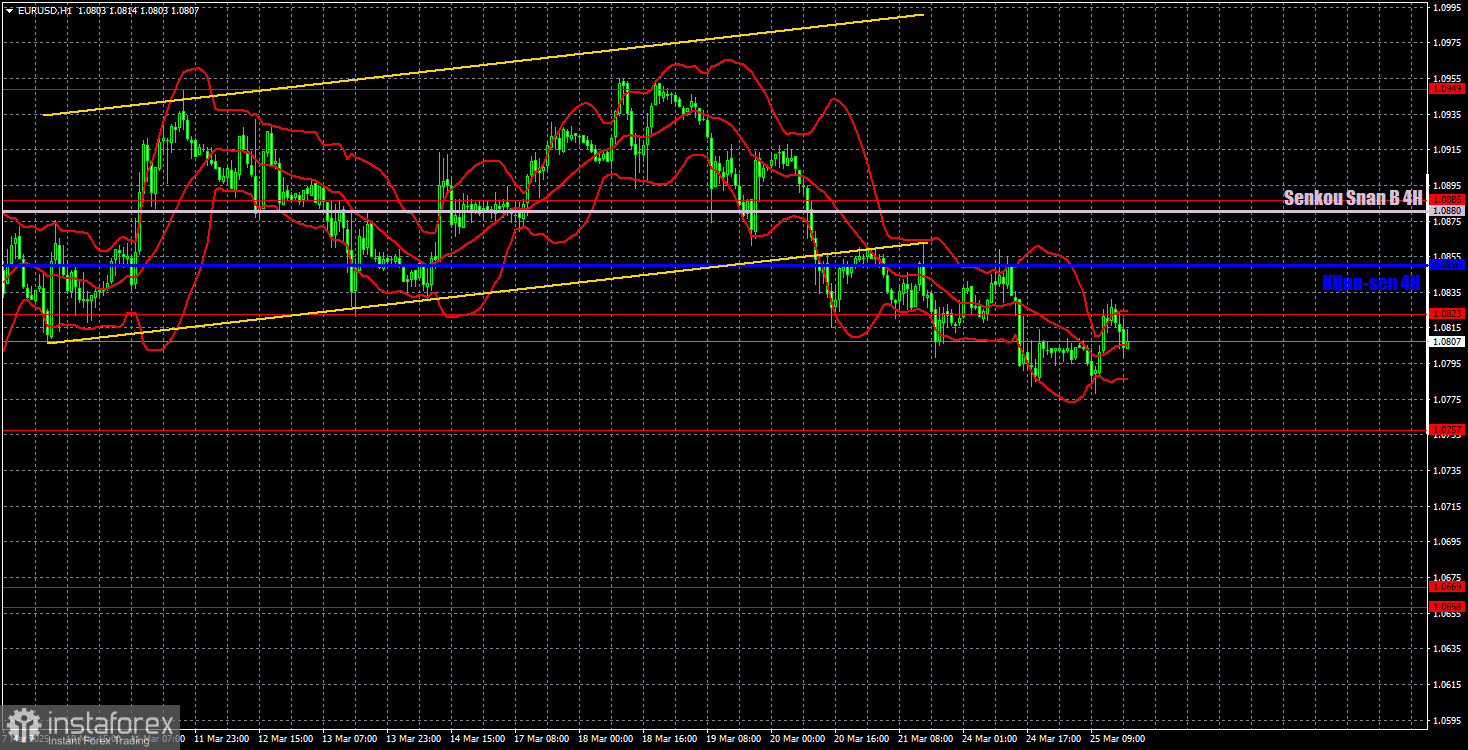
On the hourly timeframe, the EUR/USD pair is inclined to continue falling, which we fully support. We believe this decline will resume in the medium term due to the divergence in monetary policy between the ECB and the Fed. However, it remains unclear how long the market will continue to focus solely on the "Trump factor." The latest upward move looked more like a market protest directed personally at Donald Trump. Where this will ultimately lead the pair is unknown, especially since the U.S. president's tariff announcements are not over yet. Traders continue to ignore a vast array of news and reports, and the dollar is being sold off at every opportunity.
For March 26, we identify the following levels for trading: 1.0340–1.0366, 1.0461, 1.0524, 1.0585, 1.0658–1.0669, 1.0757, 1.0797, 1.0823, 1.0886, 1.0949, 1.1006, 1.1092, as well as the Senkou Span B line (1.0880) and the Kijun-sen line (1.0850). The Ichimoku indicator lines can shift throughout the day, so this should be taken into account when identifying trading signals. Don't forget to set your Stop Loss to break even once the price has moved 15 pips in the desired direction—this will help protect against potential losses if the signal turns out to be false.
On Wednesday, the U.S. will release a fairly important report on durable goods orders—and that's about it. A sharp reversal or spike in volatility may occur at the time of the report's release, but outside that window, we don't expect strong movements. Most likely, the bearish trend will persist.
Illustration Explanations:
- Support and Resistance Levels (thick red lines): Thick red lines indicate where movement may come to an end. Please note that these lines are not sources of trading signals.
- Kijun-sen and Senkou Span B Lines: Ichimoku indicator lines transferred from the 4-hour timeframe to the hourly timeframe. These are strong lines.
- Extreme Levels (thin red lines): Thin red lines where the price has previously bounced. These serve as sources of trading signals.
- Yellow Lines: Trendlines, trend channels, or any other technical patterns.
- Indicator 1 on COT Charts: Represents the net position size for each category of traders.