signal strength 2 of 5
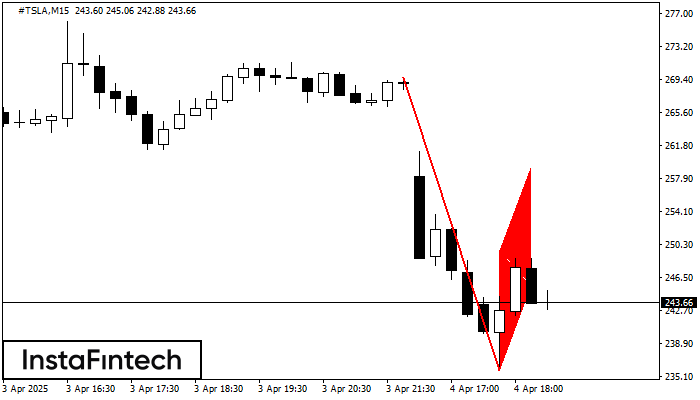
The Bearish Flag pattern has been formed on the chart #TSLA M15. Therefore, the downwards trend is likely to continue in the nearest term. As soon as the price breaks below the low at 235.81, traders should enter the market.
The M5 and M15 time frames may have more false entry points.
Juga lihat
- All
- Double Top
- Flag
- Head and Shoulders
- Pennant
- Rectangle
- Triangle
- Triple top
- All
- #AAPL
- #AMZN
- #Bitcoin
- #EBAY
- #FB
- #GOOG
- #INTC
- #KO
- #MA
- #MCD
- #MSFT
- #NTDOY
- #PEP
- #TSLA
- #TWTR
- AUDCAD
- AUDCHF
- AUDJPY
- AUDUSD
- EURCAD
- EURCHF
- EURGBP
- EURJPY
- EURNZD
- EURRUB
- EURUSD
- GBPAUD
- GBPCHF
- GBPJPY
- GBPUSD
- GOLD
- NZDCAD
- NZDCHF
- NZDJPY
- NZDUSD
- SILVER
- USDCAD
- USDCHF
- USDJPY
- USDRUB
- All
- M5
- M15
- M30
- H1
- D1
- All
- Buy
- Sale
- All
- 1
- 2
- 3
- 4
- 5
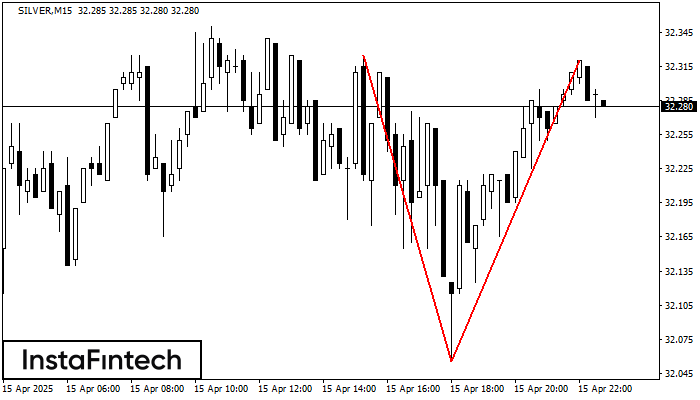
The Double Top reversal pattern has been formed on SILVER M15. Characteristics: the upper boundary 32.33; the lower boundary 32.05; the width of the pattern is 265 points. Sell trades
The M5 and M15 time frames may have more false entry points.
Open chart in a new window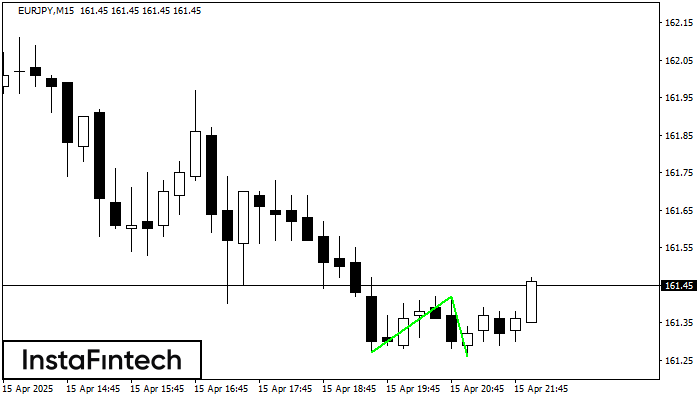
The Double Bottom pattern has been formed on EURJPY M15; the upper boundary is 161.42; the lower boundary is 161.26. The width of the pattern is 15 points. In case
The M5 and M15 time frames may have more false entry points.
Open chart in a new window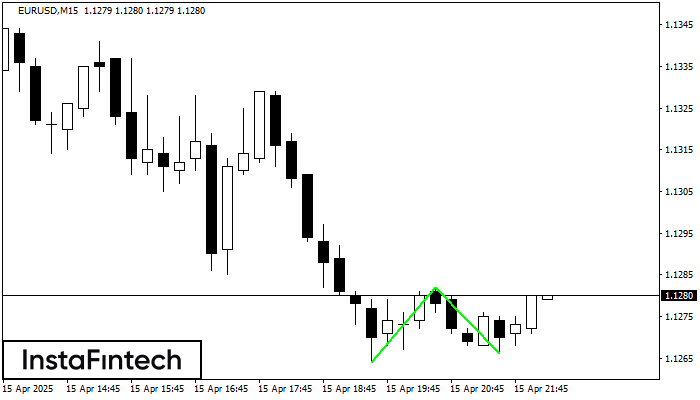
The Double Bottom pattern has been formed on EURUSD M15. Characteristics: the support level 1.1264; the resistance level 1.1282; the width of the pattern 18 points. If the resistance level
The M5 and M15 time frames may have more false entry points.
Open chart in a new window