empty
16.05.2022 10:29 AM
Tips for beginner traders in EUR/USD and GBP/USD on May 16, 2022

Details of the economic calendar from May 13

EU industrial production data showed a decline of 0.8%, with a forecast of -1.0%. Despite a slight discrepancy in indicators, the European currency remained under pressure due to the fact that previous indicators were revised for the worse.

Analysis of trading charts from May 13

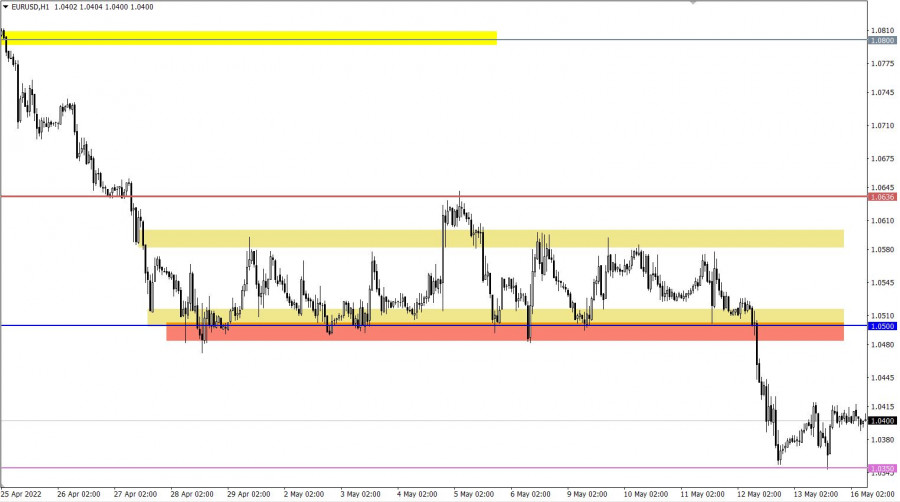
The EURUSD currency pair slowed down the downward move after the price approached the 2016 bottom. This led to a reduction in the volume of short positions and, as a result, a pullback of about 70 points.

On the trading chart of the daily period, there is an attempt to prolong the downward trend. In the future, this movement may lead to a breakdown of parity.

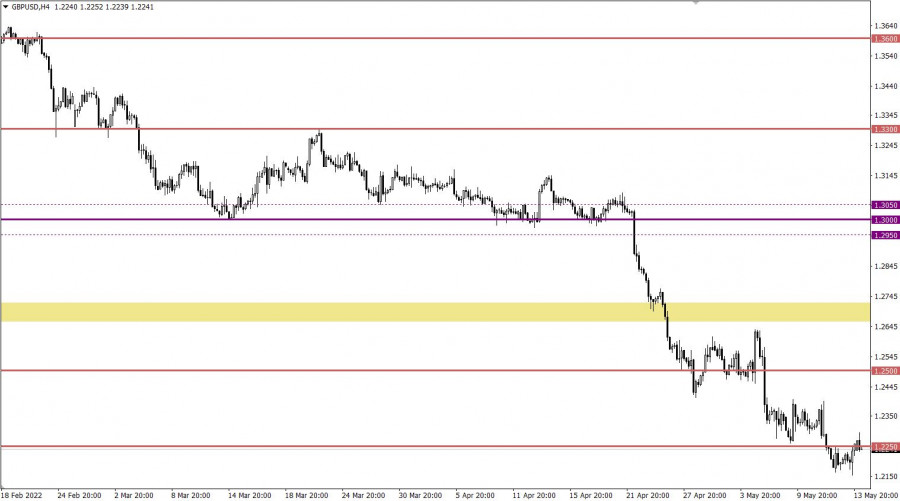
The GBPUSD currency pair, in the stage of a pullback from the variable pivot point of 1.2155, returned to the area of the level of 1.2250, where there was a slowdown. This step indicates the desire of sellers to resume the decline.

On the trading chart of the daily period, a gradual prolongation of the medium-term downward trend is observed.

This image is no longer relevant

Economic calendar for May 16

Monday is traditionally accompanied by a blank macroeconomic calendar. Nevertheless, stable information and news flow will continue to play on the nerves of speculators, which allows new jumps in the market.

Trading plan for EUR/USD on May 16

In this situation, the pullback was replaced by stagnation, where the values of 1.0350/1.0420 serve as variable boundaries of the amplitude. The optimal trading strategy is considered to be a breakdown of one or another stagnation border.

We concretize the above into trading signals:

Buy positions on the currency pair are taken into account after holding the price above the value of 1.0450 with the prospect of a move to 1.0500.

Sell positions should be considered after keeping the price below the local low of 2016, at 1.0325.

This image is no longer relevant

Trading plan for GBP/USD on May 16

Despite the slowdown, the pullback stage is still relevant in the market. In order for the downward cycle to resume, the quote must first return to the pivot point of 1.2150. This price move will indicate an increase in the volume of short positions, which will lead to the breakdown of the variable support and the trend prolongation.

An alternative market development scenario considers the price transition from the pullback stage to a full-scale correction. This movement can be indicated by a long stay of the price above 1.2250 in the daily period.

This image is no longer relevant

What is reflected in the trading charts?

A candlestick chart view is graphical rectangles of white and black light, with sticks on top and bottom. When analyzing each candle in detail, you will see its characteristics of a relative period: the opening price, closing price, and maximum and minimum prices.

Horizontal levels are price coordinates, relative to which a stop or a price reversal may occur. These levels are called support and resistance in the market.

Circles and rectangles are highlighted examples where the price of the story unfolded. This color selection indicates horizontal lines that may put pressure on the quote in the future.

The up/down arrows are the reference points of the possible price direction in the future.

Gven Podolsky,
انسٹافاریکس کا تجزیاتی ماہر
© 2007-2025
ٹائم فریم منتخب کریں
5
منٹ
15
منٹ
30
منٹ
1
گھنٹہ
4
گھنٹے
1
دن
1
ہفتہ
انسٹافاریکس کے ساتھ کرپٹو کرنسی کی معاملاتی تبدیلیوں سے کمائیں۔
میٹا ٹریڈر 4 ڈاؤن لوڈ کریں اور اپنی پہلی ٹریڈ کھولیں۔
  • Grand Choice
    Contest by
    InstaForex
    InstaForex always strives to help you
    fulfill your biggest dreams.
    مقابلہ میں شامل ہوں

تجویز کردہ مضامین

جی بی پی / یو ایس ڈی: 27 مارچ کو امریکی سیشن کے لیے تجارتی منصوبہ (صبح کی تجارت کا جائزہ)

اپنی صبح کی پیشن گوئی میں، میں نے 1.2916 کی سطح پر توجہ مرکوز کی اور اس کی بنیاد پر تجارتی فیصلے کرنے کا منصوبہ بنایا۔ آئیے

Miroslaw Bawulski 19:52 2025-03-27 UTC+2

یورو / یو ایس ڈی: 27 مارچ کو امریکی سیشن کے لیے تجارتی منصوبہ (صبح کی تجارت کا جائزہ)

اپنی صبح کی پیشن گوئی میں، میں نے 1.0769 کی سطح پر توجہ مرکوز کی اور اس کی بنیاد پر تجارتی فیصلے کرنے کا منصوبہ بنایا۔ آئیے

Miroslaw Bawulski 17:57 2025-03-27 UTC+2

27 مارچ کو برطانوی پاؤنڈ/امریکی ڈالر کے پیئر کی تجارت کیسے کی جائے؟ نئے تاجروں کے لیے آسان تجاویز اور تجارتی تجزیہ

بدھ کی تجارت کا تجزیہ برطانوی پاؤنڈ/امریکی ڈالر کا 1 گھنٹے چارٹ بدھ کو، برطانوی پاؤنڈ/امریکی ڈالر کے جوڑے نے نیچے کی طرف حرکت دکھائی جو آخر کار میکرو اکنامک

Paolo Greco 10:25 2025-03-27 UTC+2

27 مارچ کو یورو/امریکی ڈالر کے جوڑے کی تجارت کیسے کی جائے؟ نئے تاجروں کے لیے آسان تجاویز اور تجارتی تجزیہ

بدھ کی تجارت کا تجزیہ یورو/امریکی ڈالر کا 1 گھنٹے چارٹ بدھ کو، یورو/امریکی ڈالر کرنسی کے جوڑے نے اپنی سست کمی کو جاری رکھا۔ یورو

Paolo Greco 10:25 2025-03-27 UTC+2

27 مارچ کو برطانوی پاؤنڈ/امریکی ڈالر کے لیے تجارتی سفارشات اور تجزیہ: پاؤنڈ گرا، لیکن کچھ نہیں بدلا

برطانوی پاؤنڈ/امریکی ڈالر کا 5 منٹ کا تجزیہ بدھ کو برطانوی پاؤنڈ/امریکی ڈالر کرنسی جوڑی کم ٹریڈ ہوئی۔ ہم نے خبردار کیا تھا کہ جوڑی حال ہی میں پینڈولم

Paolo Greco 10:23 2025-03-27 UTC+2

27 مارچ کو یورو/امریکی ڈالر کے لیے تجارتی سفارشات اور تجزیہ: مارکیٹ کو کوئی جلدی نہیں ہے

یورو/امریکی ڈالر کا 5 منٹ کا تجزیہ یورو/امریکی ڈالر کرنسی کے جوڑے نے بدھ کے دوران کم سے کم نقصانات کے ساتھ تجارت کی، جبکہ گھنٹہ وار ٹائم فریم

Paolo Greco 10:22 2025-03-27 UTC+2

26 مارچ کو برطانوی پاؤنڈ/امریکی ڈالر کے پیئر کی تجارت کیسے کی جائے؟ نئے افراد کے لیے آسان تجاویز اور تجارتی تجزیہ

منگل کو، برطانوی پاؤنڈ/امریکی ڈالر جوڑے نے معمولی اضافے کے ساتھ تجارت کی، لیکن حالیہ ہفتوں کی مجموعی نقل و حرکت تیزی سے ایک فلیٹ مارکیٹ سے ملتی جلتی ہے۔

Paolo Greco 10:35 2025-03-26 UTC+2

26 مارچ کو یورو/امریکی ڈالر کے جوڑے کی تجارت کیسے کی جائے؟ نئے افراد کے لیے آسان تجاویز اور تجارتی تجزیہ

منگل کی تجارت کا تجزیہ یورو/امریکی ڈالر کا 1 گھنٹے چارٹ منگل کو، یورو/امریکی ڈالر کرنسی کے جوڑے نے اپنی کمزور نیچے کی حرکت کو جاری رکھا۔

Paolo Greco 10:35 2025-03-26 UTC+2

26 مارچ کو برطانوی پاؤنڈ/امریکی ڈالر کے لیے تجارتی سفارشات اور تجزیہ: پاؤنڈ کی قیمت میں مسلسل اضافہ

برطانوی پاؤنڈ/امریکی ڈالر کا 5 منٹ کا تجزیہ برطانوی پاؤنڈ/امریکی ڈالر کرنسی کے جوڑے نے منگل کو دوبارہ ترقی دکھائی۔ "دوبارہ،" کیونکہ حال ہی میں، برطانوی کرنسی کی تمام حرکتیں

Paolo Greco 10:33 2025-03-26 UTC+2

26 مارچ کو یورو/امریکی ڈالر کے لیے تجارتی سفارشات اور تجزیہ: یورو اپنی سست کمی جاری رکھے ہوئے ہے

یورو/امریکی ڈالر کرنسی کے جوڑے نے منگل کو صرف کم سے کم فائدہ کے ساتھ تجارت کی، لیکن گھنٹہ وار ٹائم فریم پر مجموعی رجحان بڑھتے ہوئے چینل سے قیمت

Paolo Greco 10:32 2025-03-26 UTC+2
ابھی فوری بات نہیں کرسکتے ؟
اپنا سوال پوچھیں بذریعہ چیٹ.
Widget callback
 

Dear visitor,

Your IP address shows that you are currently located in the USA. If you are a resident of the United States, you are prohibited from using the services of InstaFintech Group including online trading, online transfers, deposit/withdrawal of funds, etc.

If you think you are seeing this message by mistake and your location is not the US, kindly proceed to the website. Otherwise, you must leave the website in order to comply with government restrictions.

Why does your IP address show your location as the USA?

  • - you are using a VPN provided by a hosting company based in the United States;
  • - your IP does not have proper WHOIS records;
  • - an error occurred in the WHOIS geolocation database.

Please confirm whether you are a US resident or not by clicking the relevant button below. If you choose the wrong option, being a US resident, you will not be able to open an account with InstaForex anyway.

We are sorry for any inconvenience caused by this message.