signal strength 4 of 5
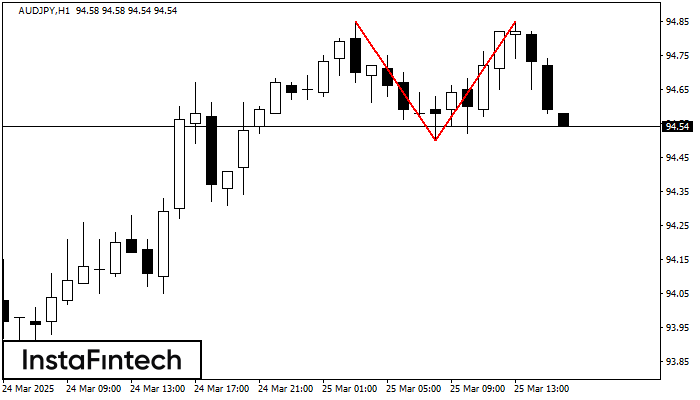
The Double Top pattern has been formed on AUDJPY H1. It signals that the trend has been changed from upwards to downwards. Probably, if the base of the pattern 94.50 is broken, the downward movement will continue.
یہ بھی دیکھیں
- All
- Double Top
- Flag
- Head and Shoulders
- Pennant
- Rectangle
- Triangle
- Triple top
- All
- #AAPL
- #AMZN
- #Bitcoin
- #EBAY
- #FB
- #GOOG
- #INTC
- #KO
- #MA
- #MCD
- #MSFT
- #NTDOY
- #PEP
- #TSLA
- #TWTR
- AUDCAD
- AUDCHF
- AUDJPY
- AUDUSD
- EURCAD
- EURCHF
- EURGBP
- EURJPY
- EURNZD
- EURRUB
- EURUSD
- GBPAUD
- GBPCHF
- GBPJPY
- GBPUSD
- GOLD
- NZDCAD
- NZDCHF
- NZDJPY
- NZDUSD
- SILVER
- USDCAD
- USDCHF
- USDJPY
- USDRUB
- All
- M5
- M15
- M30
- H1
- D1
- All
- Buy
- Sale
- All
- 1
- 2
- 3
- 4
- 5

डबल टॉप पैटर्न #Bitcoin M5 पर बना है। यह संकेत देता है कि प्रवृत्ति ऊपर से नीचे की ओर बदल गई है। संभवतः, यदि 85200.45 पैटर्न का आधार टूट जाता
M5 और M15 समय सीमा में अधिक फाल्स एंट्री पॉइंट्स हो सकते हैं।
Open chart in a new window
M5 के चार्ट के अनुसार, #Bitcoin से बुलिश आयत बना। इस प्रकार का पैटर्न प्रवृत्ति की निरंतरता कि ओर इंगित करता है। इसमें दो स्तर होते हैं: प्रतिरोध 85457.12
M5 और M15 समय सीमा में अधिक फाल्स एंट्री पॉइंट्स हो सकते हैं।
Open chart in a new window
#Bitcoin M5 पर डबल टॉप रीवर्सल पैटर्न बना है। विशेषताएं: ऊपरी सीमा 85455.73; निचली सीमा 85324.27; पैटर्न की चौड़ाई 13285 पॉइंट्स है। सेल ट्रेडों को 85324.27 की निचली सीमा के
M5 और M15 समय सीमा में अधिक फाल्स एंट्री पॉइंट्स हो सकते हैं।
Open chart in a new window