

signal strength 1 of 5
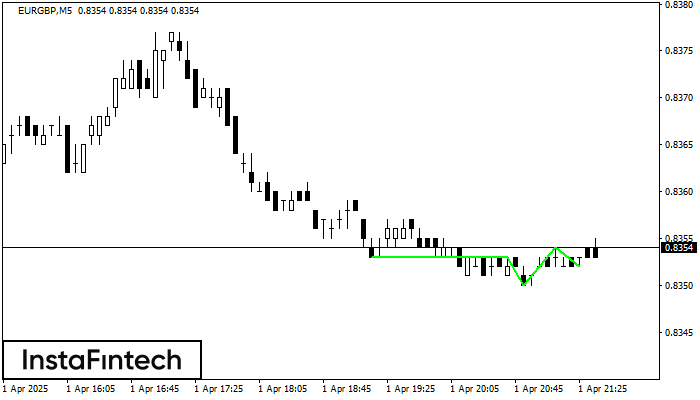
According to the chart of M5, EURGBP formed the Inverse Head and Shoulder pattern. The Head’s top is set at 0.8354 while the median line of the Neck is found at 0.8350/0.8352. The formation of the Inverse Head and Shoulder pattern evidently signals a reversal of the downward trend. In other words, in case the scenario comes true, the price of EURGBP will go towards 0.8369
The M5 and M15 time frames may have more false entry points.
یہ بھی دیکھیں
- All
- Double Top
- Flag
- Head and Shoulders
- Pennant
- Rectangle
- Triangle
- Triple top
- All
- #AAPL
- #AMZN
- #Bitcoin
- #EBAY
- #FB
- #GOOG
- #INTC
- #KO
- #MA
- #MCD
- #MSFT
- #NTDOY
- #PEP
- #TSLA
- #TWTR
- AUDCAD
- AUDCHF
- AUDJPY
- AUDUSD
- EURCAD
- EURCHF
- EURGBP
- EURJPY
- EURNZD
- EURRUB
- EURUSD
- GBPAUD
- GBPCHF
- GBPJPY
- GBPUSD
- GOLD
- NZDCAD
- NZDCHF
- NZDJPY
- NZDUSD
- SILVER
- USDCAD
- USDCHF
- USDJPY
- USDRUB
- All
- M5
- M15
- M30
- H1
- D1
- All
- Buy
- Sale
- All
- 1
- 2
- 3
- 4
- 5
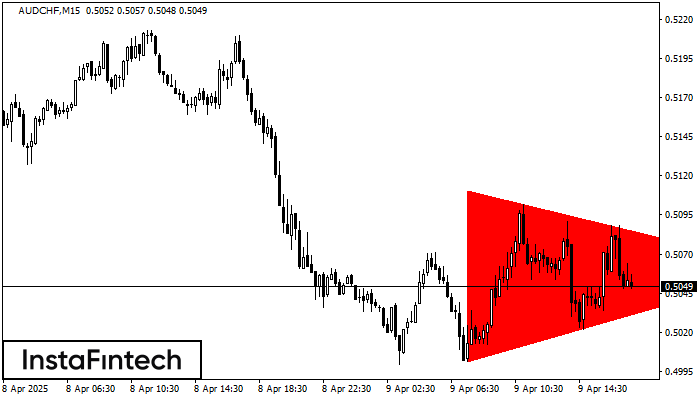
According to the chart of M15, AUDCHF formed the Bearish Symmetrical Triangle pattern. This pattern signals a further downward trend in case the lower border 0.5001 is breached. Here
The M5 and M15 time frames may have more false entry points.
Open chart in a new window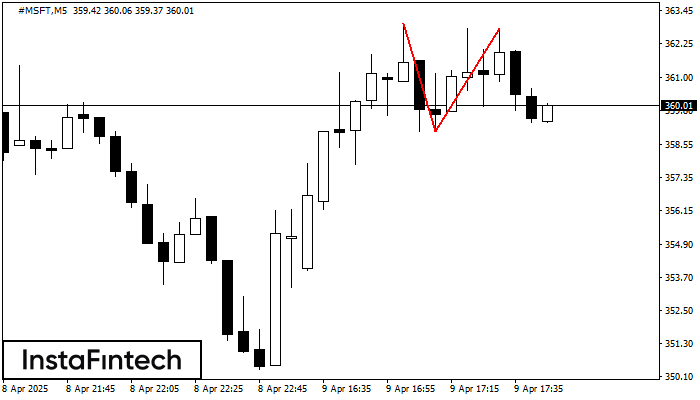
On the chart of #MSFT M5 the Double Top reversal pattern has been formed. Characteristics: the upper boundary 362.82; the lower boundary 359.05; the width of the pattern 377 points
The M5 and M15 time frames may have more false entry points.
Open chart in a new window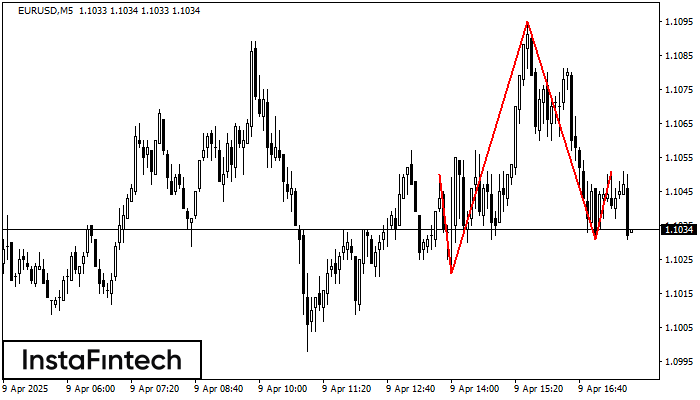
The EURUSD M5 formed the Head and Shoulders pattern with the following features: The Head’s top is at 1.1095, the Neckline and the upward angle are at 1.1021/1.1031. The formation
The M5 and M15 time frames may have more false entry points.
Open chart in a new window


