Outlook on July 28:
Analytical overview of popular currency pairs on the H1:
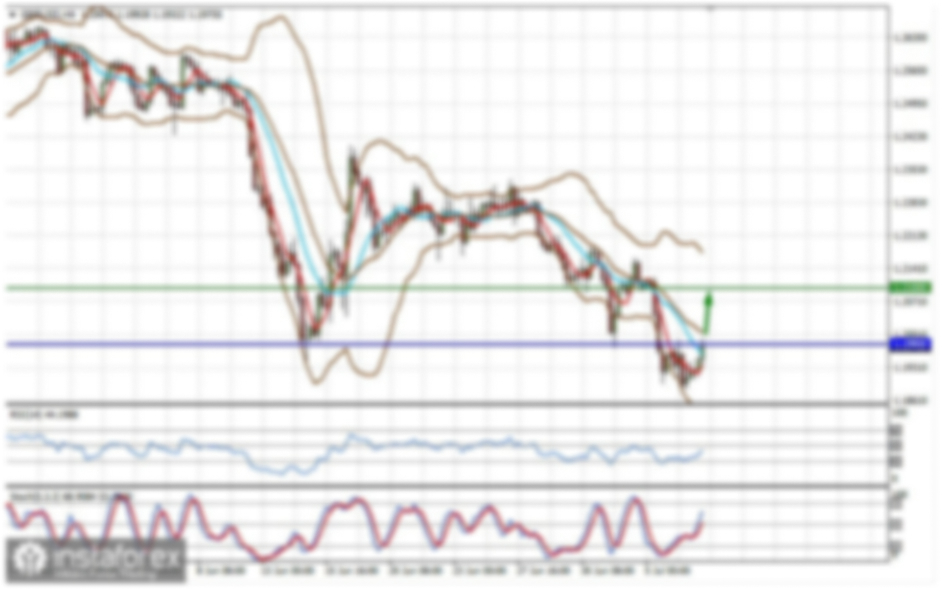
The key levels for the EUR/USD pair are 1.1881, 1.1851, 1.1825, 1.1771, 1.1758, 1.1726, and 1.1710. The price is in a correction from the downward trend on July 9 and is forming an upward potential from July 23. We expect the decline to resume after the price breaks through the noise range of 1.1771 - 1.1758. The target is set at 1.1726. The final potential downward target is 1.1710. After reaching this level, the price may consolidate and pull back upwards.
A short-term growth, in turn, is possible in the range of 1.1825 - 1.1851. If the latter is broken, it will encourage the formation of a strong upward trend. The potential target is 1.1881.
The main trend is the local downward trend from July 9, deep correction stage.
Key levels of trend development:
Upward resistance: 1.1827 Target: 1.1850
Upward resistance: 1.1853 Target: 1.1880
Downward resistance: 1.1758 Target: 1.1727
Downward resistance: 1.1725 Target: 1.1710
The key levels for the GBP/USD pair are 1.4037, 1.3967, 1.3934, 1.3893, 1.3864, 1.3837, 1.3781, and 1.3758. The price has been moving in an upward trend since July 20. We expect this trend to resume after the level of 1.3893 is broken. The target is set at 1.3934. After that, the price may consolidate in the range of 1.3934 - 1.3967. The final potential upward target is 1.4037. After reaching it, the price may consolidate and pull back downwards.
A short-term decline can be expected in the range of 1.3864 - 1.3837. If the latter is broken, a deep correction will occur. The target is set at 1.3781 and the key support is in the range of 1.3781 - 1.3758.
The main trend is the upward trend from July 20.
Key levels of trend development:
Upward resistance: 1.3900 Target: 1.3934
Upward resistance: 1.3936 Target: 1.3966
Downward resistance: 1.3863 Target: 1.3838
Downward resistance: 1.3830 Target: 1.3785
The key levels for the USD/CHF pair are 0.9275, 0.9262, 0.9239, 0.9220, 0.9194, 0.9175, 0.9145, 0.9111, 0.9098 and 0.9075. The price has been moving in a bearish trend since July 20. We expect this trend to continue after the level of 0.9145 is broken. In this case, we expect a strong development of the downward trend from July 20. The first target is 0.9111. After that, the price may consolidate in the range of 0.9111 - 0.9098. The final potential downward target is 0.9075. After reaching it, an upward pullback can be expected.
Short-term growth is likely in the 0.9175 - 0.9194 range. If the latter is broken, the upward trend will develop. The first target is set at 0.9220. There is a short-term upward movement and consolidation in the range of 0.9220 - 0.9239.
The main trend is the downward trend from July 20.
Key levels of trend development:
Upward resistance: 0.9175 Target: 0.9192
Upward resistance: 0.9196 Target: 0.9220
Downward resistance: 0.9144 Target: 0.9113
Downward resistance: 0.9098 Target: 0.9077
The key levels for the USD/JPY pair are 111.32, 111.15, 110.88, 110.61, 110.22, 109.86, 109.57, and 109.14. The price has been moving in a bullish trend since July 19, but it is currently in a deep correction and is close to canceling this trend, which requires a breakdown of the level of 109.57. The first potential downward target is 109.14.
The upward movement may possibly continue after the level of 110.22 is broken. The first target is set at 110.61. Short-term growth is expected in the 110.61 - 110.88 range. If the last value is broken, strong growth will continue to the next target of 111.15. The ultimate potential upward target is 111.32. After reaching it, the price can consolidate and pull back downwards.
The main trend is the upward trend from July 19.
Key levels of trend development:
Upward Resistance: 110.22 Target: 110.60
Upward resistance: 110.62 Target: 110.86
Downward resistance: 109.84 Target: 109.60
Downward resistance: 109.55 Target: 109.16
The key levels for the USD/CAD pair are 1.2667, 1.2624, 1.2595, 1.2537, 1.2495, 1.2467, and 1.2412. We are following the mid-term downward trend from July 19. This trend is expected to continue after the level of 1.2537 is broken. The target is set at 1.2495. After that, the price may consolidate in the 1.2495 - 1.2467 range. The ultimate potential downward target is 1.2412. After reaching it, an upward pullback will occur.
Short-term growth is possible in the range of 1.2595 - 1.2624. If the last value is broken, a deep correction will follow. The target is set at 1.2667, which is also the key support level.
The main trend is the downward trend from July 19.
Key levels of trend development:
Upward resistance: 1.2595 Movement target: 1.2623
Upward resistance: 1.2625 Movement target: 1.2665
Downward resistance: 1.2536 Target of movement: 1.2495
Downward resistance: 1.2466 Target of movement: 1.2414
The key levels for the AUD/USD pair are 0.7444, 0.7409, 0.7374, 0.7340, 0.7319, 0.7291, 0.7239 and 0.7214. The downward trend from July 6 is considered as the main trend. The price is currently in correction and has formed an upward potential from July 21. In this case, we expect a short-term decline in the range of 0.7340 - 0.7319. If the level of 0.7319 is broken, it will allow us to move to the next level of 0.7291. Its breakdown should be accompanied by a strong decline to the target of 0.7239. The final potential downward target is 0.7214. After reaching it, the price may consolidate and pull back upwards.
Meanwhile, short-term growth is likely in the range of 0.7374 - 0.7409. If the latter is broken, the upward trend from July 21 will develop. The first potential target is 0.7444.
The main trend is the downward trend from July 6, correction stage.
Key levels of trend development:
Upward resistance: 0.7376 Movement target: 0.7407
Upward resistance: 0.7410 Target of movement: 0.7444
Downward resistance: 0.7340 Target of movement: 0.7320
Downward resistance: 0.7317 Target of movement: 0.7292
The key levels for the EUR/JPY pair are 131.11, 130.90, 130.58. 130.28, 130.13, 129.67, 129.46 and 129.15. The price has been moving in a bullish trend since July 20. We expect this trend to extend after the range of 130.13 - 130.28 is broken. The target is set at 130.58 and the price may consolidate near it. If the latter is broken, strong growth will develop. The final potential upward target is 131.11. After reaching it, the price can consolidate in the range of 130.90 - 131.11 and pull back downwards.
In turn, a short-term decline is possible in the range of 129.67 - 129.46. If the last value is broken, a deep correction will occur. The target is set at 129.15, which is also the key support level.
The main trend is the upward trend from July 20.
Key levels of trend development:
Upward resistance: 130.30 Movement target: 130.56
Upward resistance: 130.60 Movement target: 130.90
Downward resistance: 129.66 Movement target: 129.48
Downward resistance: 129.45 Movement target: 129.18
The key levels for the GBP/JPY pair are 155.18, 154.29, 153.41, 153.03, 152.61, 151.96, 151.58, and 150.96. We are following the development of the mid-term upward trend from July 20. Short-term growth is expected in the range of 152.61 - 153.03. If the price breaks through the range of 153.03 - 153.41, it will lead to the development of strong growth. The target is set at 154.29 and the price may consolidate around it. The ultimate potential upward target is 155.18. After reaching it, a downward pullback can be expected.
A short-term decline is possible in the range of 151.96 - 151.58. If the latter is broken, a deep correction will follow. The target is set at 150.96, which is also the key support level.
The main trend is the mid-term upward trend from July 20.
Key levels of trend development:
Upward resistance: 152.64 Movement target: 153.03
Upward resistance: 153.42 Movement target: 154.27
Downward resistance: 151.94 Target of movement: 151.60
Downward resistance: 151.56 Target of movement: 150.98