GBP/USD 5-Minute Analysis
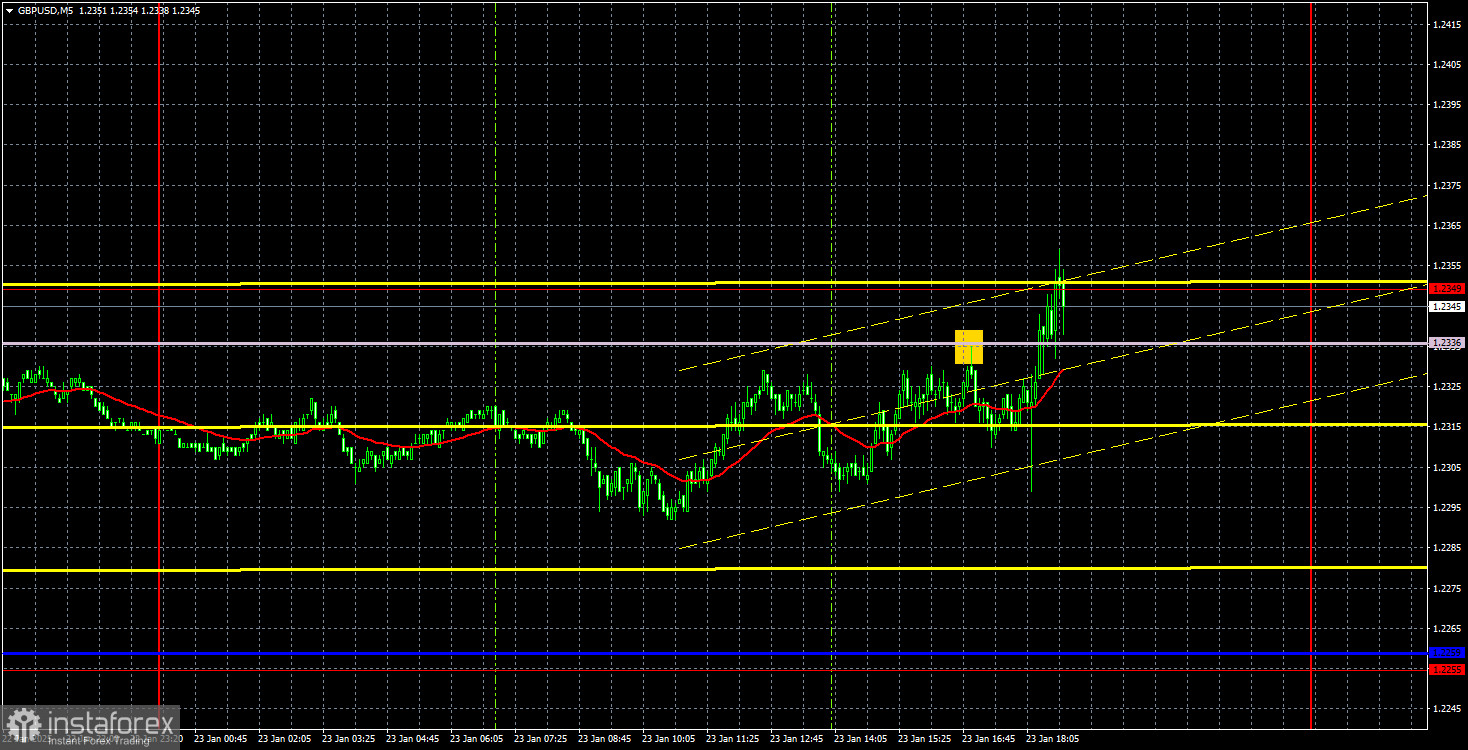
On Thursday, the GBP/USD currency pair mostly traded sideways without making significant moves either up or down. During the U.S. trading session, there was a slight upward movement, with the price reaching the 1.2336–1.2349 range. If the price breaks through this zone, the pound could advance a bit further; however, we advise maintaining a cautious perspective on the pound's potential. Fundamentally, the pound remains weak and lacks support from macroeconomic factors. Its recent rise over the past few weeks is mainly a technical correction. Thus, even a breach of the Senkou Span B line is unlikely to alter the overall outlook significantly. While the pound may continue to rise for a few more weeks or even months, the current upward movement should still be viewed as a correction.
There were no notable macroeconomic or fundamental events on Thursday, as the economic calendar was entirely empty. Friday may bring slightly more activity, but it's doubtful that the PMI data will significantly impact the market, causing a sharp rise or drop in GBP/USD. Similarly, the upcoming meetings of the Bank of England (BoE) and the Federal Reserve (Fed) are unlikely to lead to a more volatile or trending market for the pair. The primary focus remains on the ongoing correction, which typically involves complex structures, frequent pullbacks, and internal sub-corrections, making trading quite challenging.
Only one trading signal materialized during Thursday's session. In the U.S. session, the price bounced off the Senkou Span B line, moving approximately 20 pips in the desired direction. This allowed us to set a Stop Loss order to breakeven. Fortunately, this precaution proved necessary as the market reversed shortly after.
COT Report
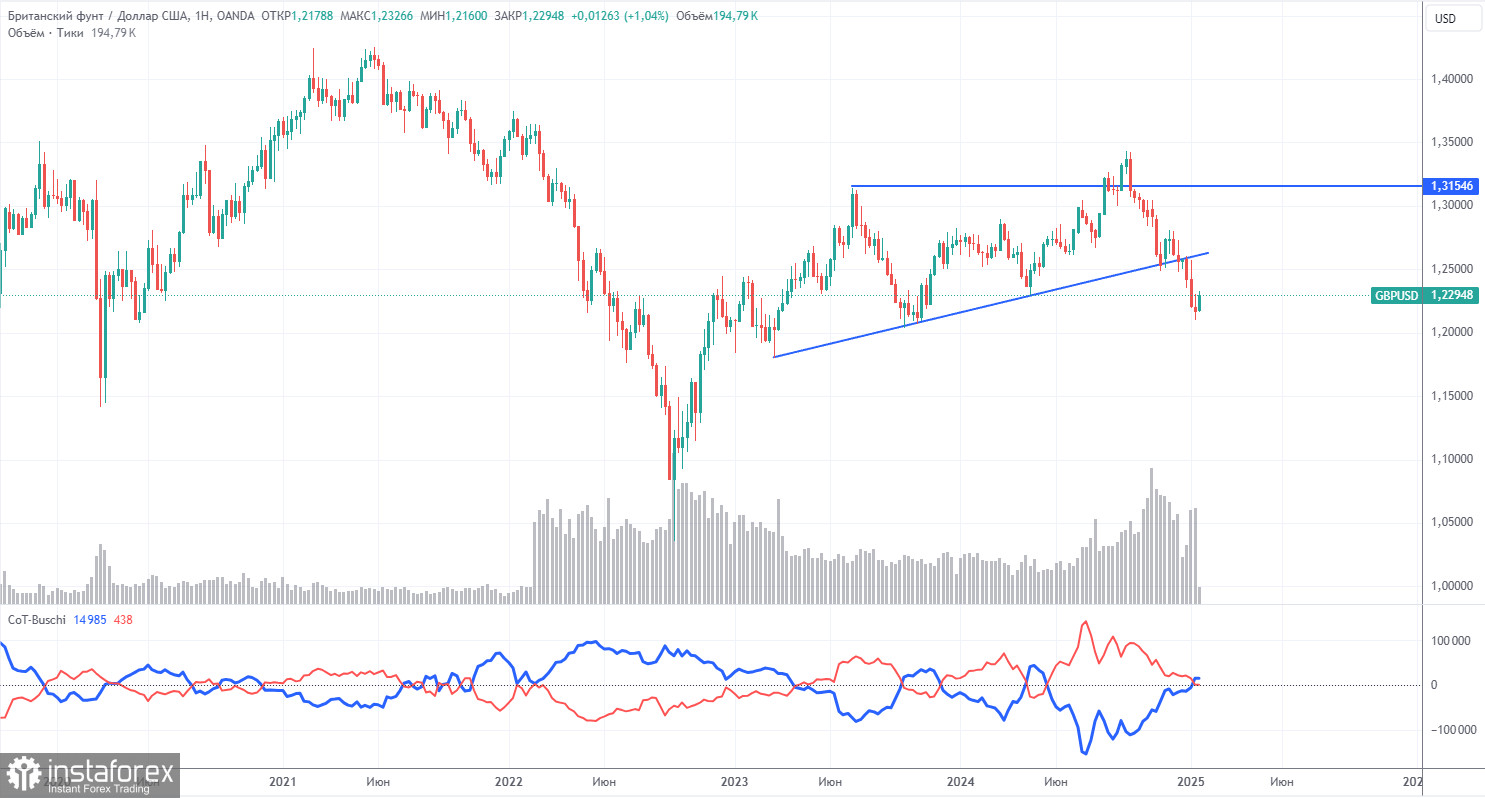
COT reports on the British pound show that the sentiment among commercial traders has been constantly changing in recent years. The red and blue lines in the reports, representing the net positions of commercial and non-commercial traders, frequently intersect and are typically close to the zero mark. Currently, these lines are near each other, suggesting there are approximately equal numbers of long and short positions.
On the weekly timeframe, the price initially broke through the 1.3154 level and then dropped to the trend line, which it successfully breached. Breaking this trend line suggests a high probability of the pound's continued decline. This concerns the long-term perspective.
According to the latest COT report, the "Non-commercial" group closed 700 buy contracts and opened 13,300 sell contracts. As a result, the net position of non-commercial traders decreased by 12,600 contracts over the week, which is negative for the pound.
The fundamental outlook still does not provide any support for long-term purchases of the pound sterling. The currency has a strong likelihood of resuming its global downward trend. Thus, the net position may continue to decline, indicating a reduced demand for the pound sterling.
GBP/USD 1-Hour Analysis
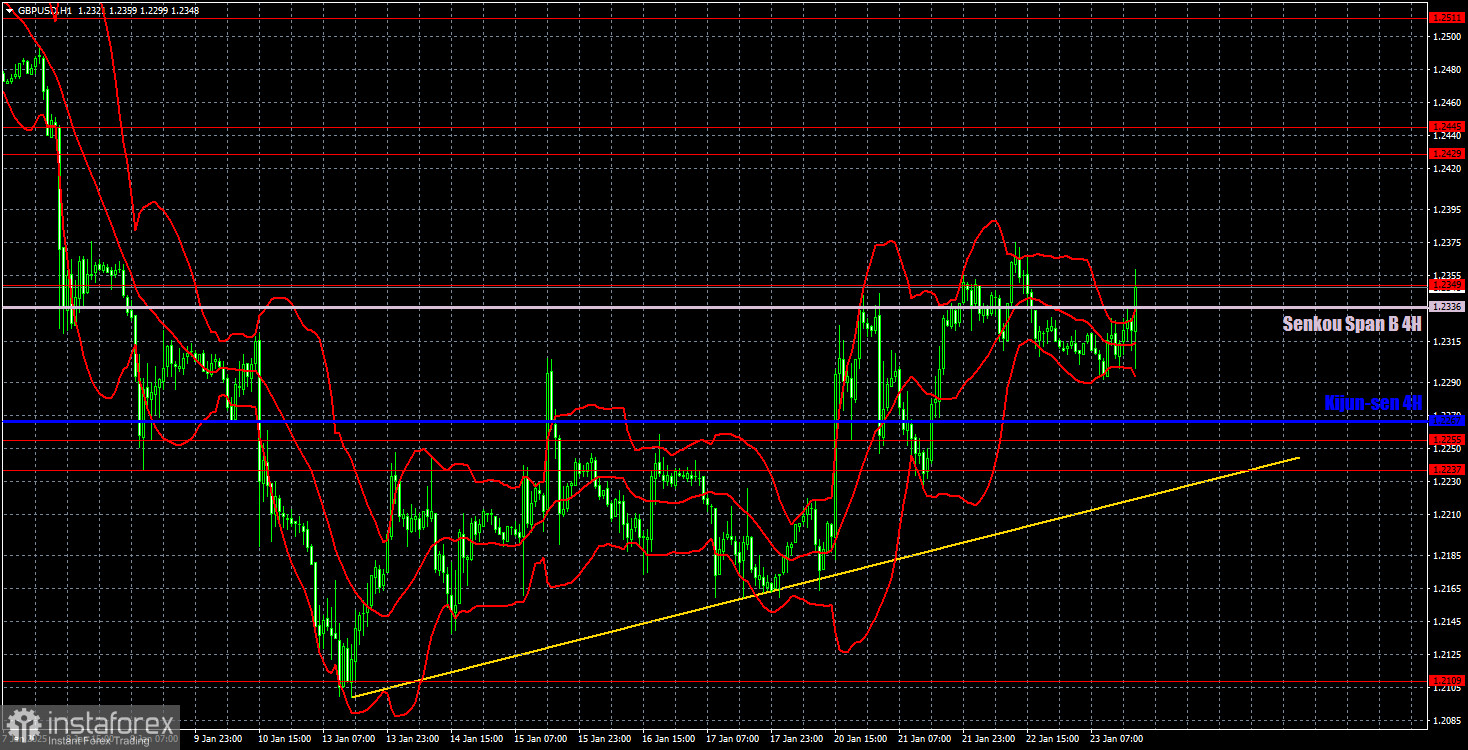
On the hourly timeframe, GBP/USD exhibits a generally bearish sentiment. While an upward trend is currently forming, it is unlikely to lead to significant growth for the pound. The pair's upward movements seem to be driven mainly by technical corrections. This pattern of weak corrections followed by strong declines has been consistently observed across various timeframes. In the medium term, we still expect a move toward $1.1800, although there are currently no signals indicating the resumption of the downtrend.
For January 24, the following key levels have been identified: 1.2052, 1.2109, 1.2237–1.2255, 1.2349, 1.2429–1.2445, 1.2511, 1.2605–1.2620, 1.2691–1.2701, and 1.2796–1.2816. The Senkou Span B (1.2336) and Kijun-sen (1.2267) lines may also provide potential trading signals. It is advisable to place a Stop Loss order at breakeven if the price moves 20 pips in the desired direction. Keep in mind that the Ichimoku indicator lines may shift throughout the day, which should be considered when identifying trading signals.
Both the U.K. and the U.S. are scheduled to release PMI data for the services and manufacturing sectors on Friday. These reports are relatively significant and may trigger short-term market reactions lasting about 30 minutes. Additionally, the U.S. will release the University of Michigan Consumer Sentiment Index, which has a medium impact. While these events could cause short-term volatility, they are unlikely to result in a major shift in the overall technical outlook.
Illustration Explanations:
- Support and Resistance Levels (thick red lines): Thick red lines indicate where movement may come to an end. Please note that these lines are not sources of trading signals.
- Kijun-sen and Senkou Span B Lines: Ichimoku indicator lines transferred from the 4-hour timeframe to the hourly timeframe. These are strong lines.
- Extreme Levels (thin red lines): Thin red lines where the price has previously bounced. These serve as sources of trading signals.
- Yellow Lines: Trendlines, trend channels, or any other technical patterns.
- Indicator 1 on COT Charts: Represents the net position size for each category of traders.