EUR/USD 5-Minute Analysis
The EUR/USD currency pair failed to show interesting movements on Wednesday. Despite a large number of scheduled events and reports, only one of them caught the market's attention. Neither Powell nor Lagarde delivered anything noteworthy or significant. The second estimate of services PMI in Germany and the EU did not elicit any market reaction. The ADP employment report for the U.S. private sector was ignored. Only the ISM Services PMI for the U.S. triggered a dollar decline, as it came in significantly below expectations. Consequently, the pair saw a slight rise in the latter half of the day.
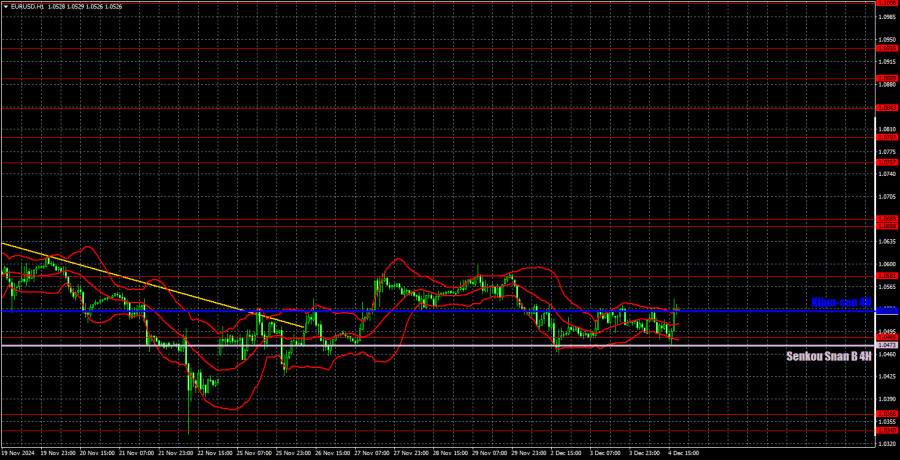
However, this rise had no real impact. In terms of the hourly timeframe, it is evident that the price has been flat this week. The pair has been flat for several weeks, albeit in a slightly broader range. Instead of a trending, volatile movement, we have a "flat within a flat" scenario—a frustrating combination for traders. Clearly, trading under such conditions is inconvenient and often meaningless. After two months of declines, the market appears to be taking a break and is doing so successfully.
Surprisingly, Wednesday's trading signals were nearly perfect. First, the price rebounded from the critical line bordering the 1.0533 level. Then, it bounced twice from the 1.0473–1.0485 area before returning to the 1.0526–1.0533 zone. Thus, traders could have initially opened short positions and then long positions. Although volatility was moderate, these two trades could have yielded 40–50 pips in profit.
COT Report
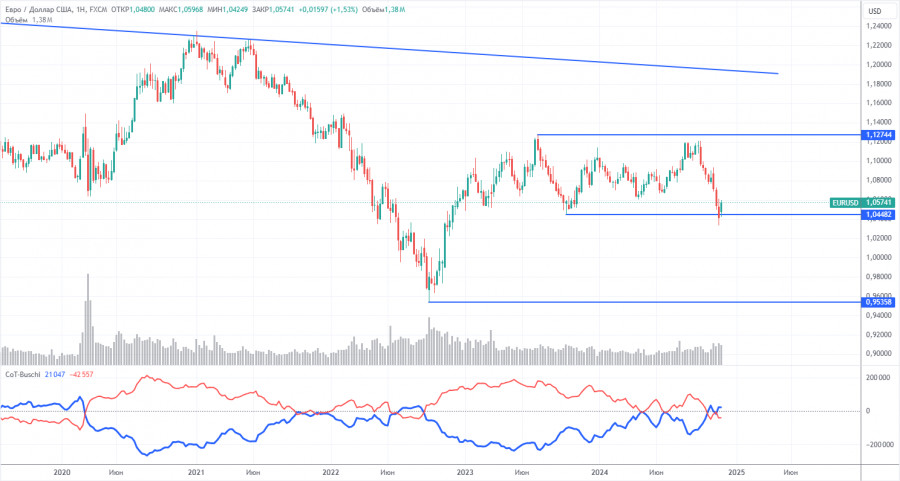
The latest Commitments of Traders (COT) report is dated November 19. The data clearly shows that the net position of non-commercial traders has been bullish for a long time, but the bearish sentiment is gradually gaining strength. A month ago, the number of short positions among professional traders surged, and for the first time in a long time, the net position turned negative. This indicates that the euro is now being sold more frequently than bought.
We continue to see no fundamental factors supporting euro strengthening, and technical analysis points to consolidation—a flat movement. On the weekly timeframe, the pair has been trading between 1.0448 and 1.1274 since December 2022. Thus, further decline remains likely. A break below 1.0448 would open up new space for a downward move.
The red and blue lines have crossed and changed their relative positions. During the last reporting week, the number of long positions in the non-commercial group fell by 5,700, while short positions rose by 29,400, leading to a net position decrease of 35,100.
EUR/USD 1-Hour Analysis
The pair has begun to correct on the hourly timeframe. The correction might be slow and complicated, but we are witnessing a flat market so far. This week's macroeconomic background from the U.S. will continue to shape the market's sentiment. We maintain that there are no solid grounds for a significant euro rally. Therefore, we anticipate the correction to end and the pair to resume its downward trend toward parity. For instance, a break below the Senkou Span B line would signal a potential resumption of the bearish trend.
We highlight the following levels for trading on December 5: 1.0269, 1.0340–1.0366, 1.0485, 1.0581, 1.0658–1.0669, 1.0757, 1.0797, 1.0843, 1.0889, and 1.0935, along with the Senkou Span B line (1.0473) and the Kijun-sen line (1.0526). Ichimoku indicator lines may shift during the day, so this should be considered when identifying trading signals. Don't forget to place a Stop Loss order at breakeven if the price moves 15 pips in your favor to safeguard against potential losses in case of false signals.
No significant events are scheduled in either the U.S. or the Eurozone on Thursday. Therefore, if the market found no reason to break out of the double flat in the first three days of the week, the chances of doing so today are even slimmer. However, traders should always be prepared for any market developments. Since the pair failed to consolidate below the Senkou Span B line, the continuation of the upward correction remains possible.
Illustration Explanations:
- Support and Resistance Levels (thick red lines): Key areas where price movement might stall. Not sources of trading signals.
- Kijun-sen and Senkou Span B Lines: Ichimoku indicator lines transferred from the H4 timeframe to the hourly chart, serving as strong levels.
- Extreme Levels (thin red lines): Points where the price has previously rebounded. They can serve as trading signal sources.
- Yellow Lines: Trendlines, channels, or other technical patterns.
- Indicator 1 on COT Charts: Reflects the net position size of each trader category.


