empty
16.12.2022 11:53 AM
Technical analysis of EUR/USD for December 16, 2022

This image is no longer relevant

Overview :

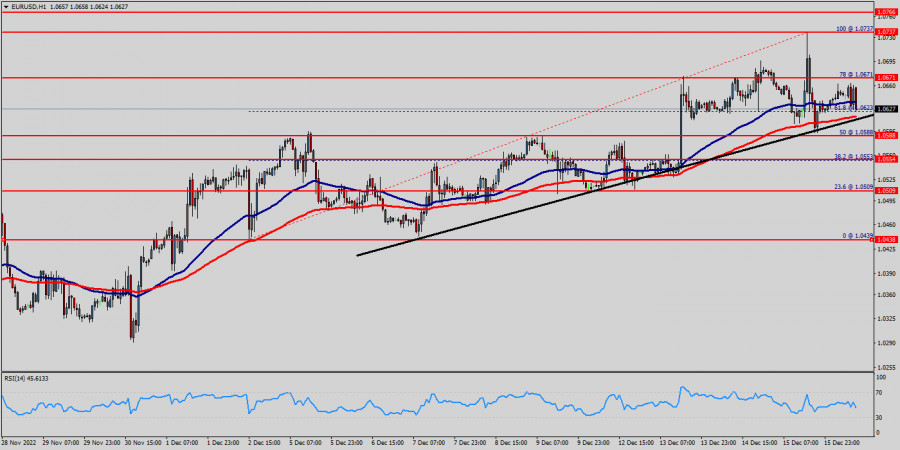
The EUR/USD pair faced a minor resistance at the level of 1.0671, while major resistance is seen at 1.0737. Support is found at the levels of 1.0588 and 1.0554. Also, it should be noted that a daily pivot point has already set at the level of 1.0588. The EUR/USD pair is still moving around the key level at 1.0588, which represents a daily bottom in the H1 time frame at the moment. The EUR/USD pair will continue rising from the level of 1.0588 in the long term. It should be noted that the support is established at the level of 1.0588 which represents the daily pivot point.

The EUR/USD pair continued to move upwards from the level of 1.0588. The pair rose from the level of 1.0588 to the top around 1.0737. However, the trend rebounded from the top point of 1.0737 to close at 1.0618.

The level of 1.0588 is expected to act as major support today. According to the previous events, the EUR/USD pair is still moving between the levels of 1.0588 and 1.0737.

Therefore, we expect a range of 149 pips in coming two days. The trend is still above the 100 EMA for that the bullish outlook remains the same as long as the 100 EMA is headed to the upside.

But, the price spot of 1.0588 remains a significant support zone. Since the trend is above the last bearish wave, the market is still in an uptrend. Overall, we still prefer the bullish scenario. Consequently, there is a possibility that the EUR/USD pair will move upside.

The structure of scaling does not look corrective. In order to indicate a bullish opportunity above the area of 1.0588, buy above the price of 1.0588 with the first target at 1.0737 (double top).

The EUR/USD pair has broken resistance at the level of 1.0588 which acts as support now. Thus, the pair has already formed minor support at 1.0588.

The strong support is seen at the level of 1.0554 because it represents the weekly support 1. Technical readings in the daily chart favor a bullish continuation, as indicators maintain their firmly bullish slopes within positive levels, while the 100 MA heads firmly higher below the current level. Equally important, the RSI and the moving average (100) are still calling for an uptrend.

Therefore, the market indicates a bullish opportunity at the level of 1.0588 in the H1 chart. Also, if the trend is buoyant, then the currency pair strength will be defined as following: EUR is in an uptrend and USD is in a downtrend. Buy above the minor support of 1.0588 (this price is coinciding with the ratio of 50% Fibonacci) with the first target at 1.0737, and continue towards 1.0766 (the weekly resistance 2).

Next objective will target at 1.0803 in coming days. On the other hand, if the price closes below the minor support (1.0588), the best location for the stop loss order is seen below 1.0554; hence, the price will fall into the bearish market in order to go further towards the strong support at 1.0509 to test it again.

The level of 1.0509 will form a double bottom. On the downside, break of 1.0588 minor support will suggest that such rebound has completed and bring retest of 1.0509 low instead.

เลือกช่วงเวลา
5
นาที
15
นาที
30
นาที
1
ชั่วโมง
4
ชั่วโมง
1
วัน
1
สัปดาห์
รับผลกำไรจากการเปลี่ยนแปลงอัตราสกุลเงินดิจิทัลกับ InstaForex.
ดาวน์โหลด MetaTrader 4 และเปิดการซื้อขายครั้งแรกของคุณ.
USD/JPY: เคล็ดลับการเทรดอย่างง่ายสำหรับเทรดเดอร์มือใหม่ในวันที่ 26 มีนาคม (ช่วงการตลาดสหรัฐฯ) บทวิจารณ์การซื้อขายและคำแนะนำการซื้อขายสำหรับเงินเยนญี่ปุ่น ไม่มีการทดสอบระดับที่กำหนดไว้ในช่วงครึ่งแรกของวัน ในช่วงการซื้อขายของสหรัฐฯ คาดว่าจะมีการกล่าวสุนทรพจน์ชุดหนึ่งโดยสมาชิกของคณะกรรมการตลาดเสรี (FOMC) ซึ่งในสัปดาห์นี้พวกเขาให้การสนับสนุนดอลลาร์สหรัฐ จึงควรติดตามการสัมภาษณ์ของพวกเขาอย่างใกล้ชิด โดยเฉพาะการสัมภาษณ์ Neel Kashkari และ Alberto Musalem ซึ่งคาดว่าพวกเขาจะได้กล่าวถึงสถานการณ์เงินเฟ้อในปัจจุบันและแนวโน้มนโยบายการเงิน หากมีการใช้ถ้อยคำแบบฮอว์คิช
  • Grand Choice
    Contest by
    InstaForex
    InstaForex always strives to help you
    fulfill your biggest dreams.
    เข้าร่วมการแข่งขัน


บทความแนะนำ

สัญญาณการซื้อขายสำหรับ EUR/USD ระหว่างวันที่ 26-28 มีนาคม 2025: ขายต่ำกว่า 1.0808 (21 SMA - 8/8 Murray)

ในช่วงเช้าของเซสชันอเมริกา คู่เงิน EUR/USD กำลังซื้อขายอยู่ที่ประมาณ 1.0786 ต่ำกว่าค่า 21SMA โดยเครื่องมือนี้กำลังตามแนวโน้มขาลง ครั้งหนึ่งเคยขึ้นสูงถึง 1.0940 EUR/USD ได้ลดต่ำลงหลายเซสชันติดต่อกัน ยุโรปอาจยังคงลดลงต่อไป ซึ่งเราสามารถมองหาโอกาสในการขายต่ำกว่า 21SMA

Dimitrios Zappas 15:13 2025-03-26 UTC+2

สัญญาณการซื้อขาย GOLD (XAU/USD) สำหรับวันที่ 26-28 มีนาคม 2025: ขายต่ำกว่า $3,034 (21 SMA - 7/8 Murray)

ราคาทองคำอาจยังคงอยู่ในแนวโน้มขาลงในอีกไม่กี่วันข้างหน้า เพื่อยืนยันแนวโน้มขาลง เราควรคาดหวังให้ราคาทองคำคงที่ต่ำกว่า 3,020 แล้วราคาจะสามารถไปถึงระดับ 6/8 Murray ที่ 2,968 และในที่สุดจะไปถึงเส้นค่าเฉลี่ยเคลื่อนที่ 200 (200 EMA) ประมาณ 2,939

Dimitrios Zappas 15:11 2025-03-26 UTC+2

การคาดการณ์ Forex 26/03/2025: EUR/USD, GBP/USD, ทองคำ และ Bitcoin

ลิงก์ที่เป็นประโยชน์: บทความอื่น ๆ ของฉันมีอยู่ในส่วนนี้ คอร์ส InstaForex สำหรับผู้เริ่มต้น การวิเคราะห์ที่ได้รับความนิยม เปิดบัญชีเทรด สิ่งสำคัญ: ผู้เริ่มต้นในการเทรดฟอเร็กซ์ต้องระมัดระวังเป็นพิเศษเมื่อทำการตัดสินใจเกี่ยวกับการเข้าสู่ตลาด ก่อนการเผยแพร่รายงานสำคัญ ควรหลีกเลี่ยงการเข้าสู่ตลาดเพื่อหลีกเลี่ยงการจับตัวในสภาวะที่ตลาดผันผวนอย่างรวดเร็วจากความผันผวนที่เพิ่มขึ้น หากคุณตัดสินใจที่จะทำการเทรดในช่วงการเผยแพร่ข่าว ควรตั้งคำสั่งหยุดขาดทุนเสมอเพื่อลดความเสียหาย

Sebastian Seliga 10:35 2025-03-26 UTC+2

EUR/USD. วันที่ 26 มีนาคม กำลังเตรียมพร้อมสำหรับการโจมตีครั้งใหม่

ในวันอังคาร คู่สกุลเงิน EUR/USD ได้กลับมายังเขตแนวรับที่ 1.0781–1.0797 อีกครั้ง แต่กลุ่มกระทิงแสดงสัญญาณอ่อนแอเนื่องจากขาดข่าวสนับสนุน วันนี้คู่นี้ได้กลับมายังเขต 1.0781–1.0797 อีกครั้ง การตีกลับจากบริเวณนี้อาจส่งผลให้เกิดการเคลื่อนตัวขึ้นเล็กน้อยไปยังระดับฟีโบนักชีปรับฐานที่ 200.0% ที่ 1.0857 การแตกและการยืนใต้โซนนี้จะบ่งบอกถึงการล่วงลงต่อไปยังระดับปรับฐานถัดไปที่

Samir Klishi 10:32 2025-03-26 UTC+2

GBP/USD วันที่ 26 มีนาคม แนวโน้มเงินเฟ้ออาจส่งผลต่อเงินปอนด์

ในกราฟรายชั่วโมง คู่เงิน GBP/USD ยังคงเคลื่อนไหวด้านข้างในวันอังคาร โดยไม่มีการตอบสนองต่อระดับ 1.2931 ดังนั้น การปิดตัวใหม่เหนือหรือต่ำกว่าระดับนี้จะไม่ถูกพิจารณาว่าเป็นสัญญาณการเทรด ขณะนี้พวก Bear เริ่มโจมตีสวนกลับ แต่ดูเหมือนว่ากำลังของพวกเขาจะค่อนข้างจำกัด สถานการณ์ของคลื่นนั้นกระจ่างแจ้งอย่างสมบูรณ์ คลื่นขาลงที่เสร็จสิ้นล่าสุดไม่สามารถทำลายจุดต่ำสุดก่อนหน้านี้ ในขณะที่คลื่นขาขึ้นสุดท้ายผ่านจุดสูงก่อนหน้าไปได้

Samir Klishi 10:29 2025-03-26 UTC+2

การวิเคราะห์ทางเทคนิคของการเคลื่อนไหวของราคาภายในวันของคู่สกุลเงิน AUD/JPY วันพุธที่ 26 มีนาคม 2025

เมื่อดูที่กราฟ 4 ชั่วโมง สำหรับคู่เงิน AUD/JPY จะเห็นได้ว่าเคลื่อนไหวในกรอบ Bullish channel อย่างสมดุล และอยู่เหนือเส้น EMA (21) ที่มีความชันลักษณะเอียงขึ้น โดยมีการยืนยันด้วยการปรากฏของ Convergence

Arief Makmur 09:34 2025-03-26 UTC+2

การวิเคราะห์ทางเทคนิคของการเคลื่อนไหวของราคาภายในวัน ของดัชนี Nasdaq 100, วันพุธที่ 26 มีนาคม 2025

20405.7 ด้วยการปรากฏตัวของการบรรจบกันระหว่างการเคลื่อนไหวของราคาดัชนี Nasdaq 100 และตัวบ่งชี้ Stochastic Oscillator และการเคลื่อนไหวของราคาดัชนีที่เคลื่อนตัวเหนือเส้น EMA (21) ซึ่งมีแนวโน้มเอียงขึ้น ในอนาคตอันใกล้ #NDX มีแนวโน้มที่จะถูกปรับแก้จากการอ่อนตัวและกลับมาแข็งแกร่งขึ้นสู่ระดับ 20405.7

Arief Makmur 09:34 2025-03-26 UTC+2

EUR/USD และ GBP/USD วันที่ 26 มีนาคม – การวิเคราะห์ทางเทคนิค

เมื่อต้นสัปดาห์ ผู้เล่นขาลงพยายามยืนยันและขยายแนวโน้มขาลงที่มีอยู่ แต่ยังไม่ได้ผลสำเร็จที่แข็งแกร่ง — คู่ยังคงเคลื่อนไหวใกล้ระดับรายสัปดาห์ (1.0819 – 1.0828) หากการลดลงสามารถก้าวหน้าได้ เป้าหมายใกล้ที่สุดและโซนรองรับถัดไปสำหรับวันนี้อยู่ที่ 1.0727 – 1.0698 (เส้น Tenkan

Evangelos Poulakis 04:26 2025-03-26 UTC+2

EUR/USD. วันที่ 25 มีนาคม สัปดาห์ข้างหน้าน่าเบื่อ

ในวันจันทร์ คู่เงิน EUR/USD ดีดตัวจากระดับ Fibonacci retracement ที่ 200.0% ที่ 1.0857 กลับทิศทางในความโปรดปรานของดอลลาร์สหรัฐ และลดลงไปยังโซนสนับสนุนที่ 1.0781–1.0797 การดีดตัวจากโซนนี้ในวันนี้จะเป็นสัญญาณที่ดีต่อยูโรและกระตุ้นให้เกิดการเคลื่อนไหวด้านราคาขึ้นใหม่ไปที่ระดับ 1.0857

Samir Klishi 18:04 2025-03-25 UTC+2

GBP/USD วันที่ 25 มีนาคม เงินปอนด์เข้าสู่ช่วงการเคลื่อนไหวในช่วงข้าง

บนกราฟรายชั่วโมง คู่เงิน GBP/USD สามารถยืนอยู่เหนือระดับ 1.2931 ได้ในวันจันทร์ แต่ฝั่งแรงซื้อไม่สามารถยืนตลาดให้อยู่ในระดับสูงได้และหลังจากนั้นถอยกลับลงมา คู่เงินดังกล่าวจึงลดลงต่ำกว่าระดับ 1.2931 อีกครั้ง การลดลงอาจดำเนินต่อไปในวันนี้ไปจนถึงระดับ 1.2865 แต่การเคลื่อนไหวของปอนด์ในช่วงไม่กี่สัปดาห์ที่ผ่านมาดูเหมือนว่าจะเป็นแนวโน้มด้านข้าง ดังนั้นฉันไม่คาดว่าราคาจะลดลงต่ำกว่า 1.2865

Samir Klishi 17:58 2025-03-25 UTC+2
หากไม่สะดวกคุยในตอนนี้
ระบุคำถามไว้ได้ใน แชท.
Widget callback
 

Dear visitor,

Your IP address shows that you are currently located in the USA. If you are a resident of the United States, you are prohibited from using the services of InstaFintech Group including online trading, online transfers, deposit/withdrawal of funds, etc.

If you think you are seeing this message by mistake and your location is not the US, kindly proceed to the website. Otherwise, you must leave the website in order to comply with government restrictions.

Why does your IP address show your location as the USA?

  • - you are using a VPN provided by a hosting company based in the United States;
  • - your IP does not have proper WHOIS records;
  • - an error occurred in the WHOIS geolocation database.

Please confirm whether you are a US resident or not by clicking the relevant button below. If you choose the wrong option, being a US resident, you will not be able to open an account with InstaForex anyway.

We are sorry for any inconvenience caused by this message.