empty
сформирован 25.03 в 20:05:23 (UTC+0)
сила сигнала 1 из 5
Бычий симметричный треугольник EURNZD M5

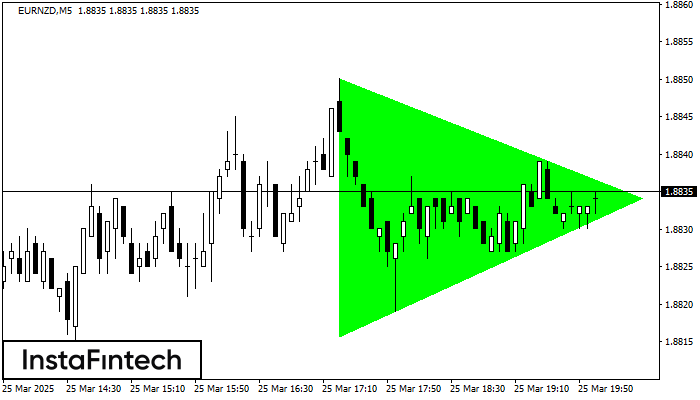
По EURNZD на M5 сформировалась фигура «Бычий симметричный треугольник», которая сигнализирует нам о продолжении тенденции. Характеристика: Верхняя граница фигуры имеет координаты 1.8850/1.8834; Нижняя граница 1.8816/1.8834; Проекция ширины фигуры 34 пунктов. Формирование фигуры «Бычий симметричный треугольник» на восходящем тренде свидетельствует о продолжении текущего движения, где, в случае пробоя значения 1.8834, возможно движение к 1.8849.

Таймфреймы М5 и М15 могут иметь больше ложных точек входа.

Фигура
  • Все
  • Вымпел
  • Голова и плечи
  • Двойная вершина
  • Прямоугольник
  • Треугольник
  • Тройная вершина
  • Флаг
Инструмент
  • Все
  • #AAPL
  • #AMZN
  • #Bitcoin
  • #EBAY
  • #FB
  • #GOOG
  • #INTC
  • #KO
  • #MA
  • #MCD
  • #MSFT
  • #NTDOY
  • #PEP
  • #TSLA
  • #TWTR
  • AUDCAD
  • AUDCHF
  • AUDJPY
  • AUDUSD
  • EURCAD
  • EURCHF
  • EURGBP
  • EURJPY
  • EURNZD
  • EURRUB
  • EURUSD
  • GBPAUD
  • GBPCHF
  • GBPJPY
  • GBPUSD
  • GOLD
  • NZDCAD
  • NZDCHF
  • NZDJPY
  • NZDUSD
  • SILVER
  • USDCAD
  • USDCHF
  • USDJPY
  • USDRUB
Таймфрейм
  • Все
  • M5
  • M15
  • M30
  • H1
  • D1
Тренд
  • Все
  • Покупка
  • Продажа
Сила сигнала
  • Все
  • 1
  • 2
  • 3
  • 4
  • 5
Bullish Symmetrical Triangle
сформирован 27.03 в 01:21:01 (UTC+0)
сила сигнала 1 из 5
Bullish Symmetrical Triangle USDCHF M5

According to the chart of M5, USDCHF formed the Bullish Symmetrical Triangle pattern. Description: This is the pattern of a trend continuation. 0.8847 and 0.8835 are the coordinates

The M5 and M15 time frames may have more false entry points.

Открыть график инструмента в новом окне
Double Bottom
сформирован 27.03 в 00:00:29 (UTC+0)
сила сигнала 3 из 5
Double Bottom NZDCAD M30

The Double Bottom pattern has been formed on NZDCAD M30; the upper boundary is 0.8209; the lower boundary is 0.8165. The width of the pattern is 43 points. In case

Открыть график инструмента в новом окне
Double Top
сформирован 27.03 в 00:00:20 (UTC+0)
сила сигнала 5 из 5
Double Top GBPAUD D1

On the chart of GBPAUD D1 the Double Top reversal pattern has been formed. Characteristics: the upper boundary 2.0644; the lower boundary 2.0321; the width of the pattern 323 points

Открыть график инструмента в новом окне
Hozir telefon orqali gaplasha olmaysizmi?
Savolingizni bering chatda.
Обратный звонок
 

Dear visitor,

Your IP address shows that you are currently located in the USA. If you are a resident of the United States, you are prohibited from using the services of InstaFintech Group including online trading, online transfers, deposit/withdrawal of funds, etc.

If you think you are seeing this message by mistake and your location is not the US, kindly proceed to the website. Otherwise, you must leave the website in order to comply with government restrictions.

Why does your IP address show your location as the USA?

  • - you are using a VPN provided by a hosting company based in the United States;
  • - your IP does not have proper WHOIS records;
  • - an error occurred in the WHOIS geolocation database.

Please confirm whether you are a US resident or not by clicking the relevant button below. If you choose the wrong option, being a US resident, you will not be able to open an account with InstaForex anyway.

We are sorry for any inconvenience caused by this message.