empty
сформирован 26.03 в 07:00:22 (UTC+0)
сила сигнала 3 из 5
Тройное дно USDCAD M30

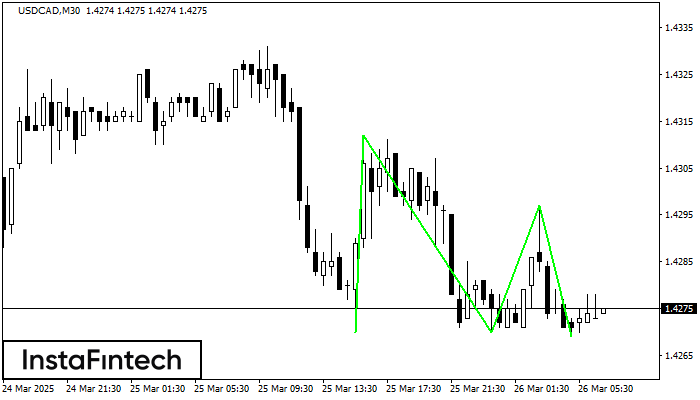
По USDCAD на M30 сформировалась фигура «Тройное дно». Характеристика: Нижняя граница фигуры имеет координаты 1.4269, при этом верхняя граница 1.4312/1.4297. Проекция ширины 42 пунктов. Формирование фигуры «Тройное дно» наиболее вероятным образом свидетельствует об изменении тренда с нисходящего на восходящий. Это означает, что в случае пробоя нижней границы 1.4269 курс, с наибольшей вероятностью, продолжит восходящее движение.

Shuningdek ko'ring

Фигура
  • Все
  • Вымпел
  • Голова и плечи
  • Двойная вершина
  • Прямоугольник
  • Треугольник
  • Тройная вершина
  • Флаг
Инструмент
  • Все
  • #AAPL
  • #AMZN
  • #Bitcoin
  • #EBAY
  • #FB
  • #GOOG
  • #INTC
  • #KO
  • #MA
  • #MCD
  • #MSFT
  • #NTDOY
  • #PEP
  • #TSLA
  • #TWTR
  • AUDCAD
  • AUDCHF
  • AUDJPY
  • AUDUSD
  • EURCAD
  • EURCHF
  • EURGBP
  • EURJPY
  • EURNZD
  • EURRUB
  • EURUSD
  • GBPAUD
  • GBPCHF
  • GBPJPY
  • GBPUSD
  • GOLD
  • NZDCAD
  • NZDCHF
  • NZDJPY
  • NZDUSD
  • SILVER
  • USDCAD
  • USDCHF
  • USDJPY
  • USDRUB
Таймфрейм
  • Все
  • M5
  • M15
  • M30
  • H1
  • D1
Тренд
  • Все
  • Покупка
  • Продажа
Сила сигнала
  • Все
  • 1
  • 2
  • 3
  • 4
  • 5
Bullish Rectangle
сформирован 02.04 в 05:02:20 (UTC+0)
сила сигнала 1 из 5
Bullish Rectangle EURGBP M5

According to the chart of M5, EURGBP formed the Bullish Rectangle. The pattern indicates a trend continuation. The upper border is 0.8356, the lower border is 0.8352. The signal means

The M5 and M15 time frames may have more false entry points.

Открыть график инструмента в новом окне
Double Top
сформирован 02.04 в 05:00:27 (UTC+0)
сила сигнала 2 из 5
Double Top GBPJPY M15

The Double Top pattern has been formed on GBPJPY M15. It signals that the trend has been changed from upwards to downwards. Probably, if the base of the pattern 193.33

The M5 and M15 time frames may have more false entry points.

Открыть график инструмента в новом окне
Bullish Rectangle
сформирован 02.04 в 04:46:22 (UTC+0)
сила сигнала 1 из 5
Bullish Rectangle GOLD M5

According to the chart of M5, GOLD formed the Bullish Rectangle which is a pattern of a trend continuation. The pattern is contained within the following borders: the lower border

The M5 and M15 time frames may have more false entry points.

Открыть график инструмента в новом окне
Hozir telefon orqali gaplasha olmaysizmi?
Savolingizni bering chatda.
Обратный звонок
 

Dear visitor,

Your IP address shows that you are currently located in the USA. If you are a resident of the United States, you are prohibited from using the services of InstaFintech Group including online trading, online transfers, deposit/withdrawal of funds, etc.

If you think you are seeing this message by mistake and your location is not the US, kindly proceed to the website. Otherwise, you must leave the website in order to comply with government restrictions.

Why does your IP address show your location as the USA?

  • - you are using a VPN provided by a hosting company based in the United States;
  • - your IP does not have proper WHOIS records;
  • - an error occurred in the WHOIS geolocation database.

Please confirm whether you are a US resident or not by clicking the relevant button below. If you choose the wrong option, being a US resident, you will not be able to open an account with InstaForex anyway.

We are sorry for any inconvenience caused by this message.