empty
сформирован 01.04 в 05:50:43 (UTC+0)
сила сигнала 2 из 5
Медвежий симметричный треугольник NZDCHF M15

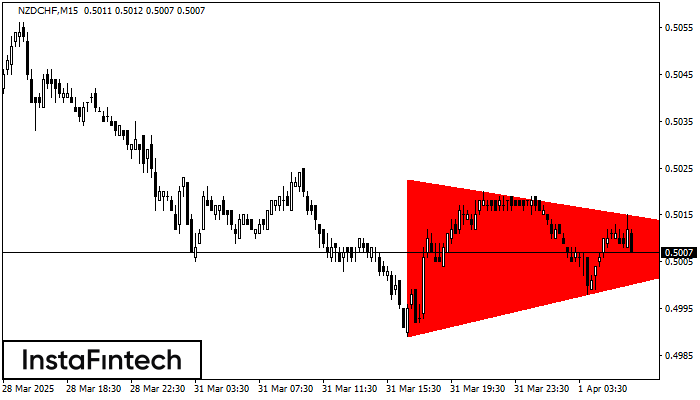
На графике NZDCHF на M15 сформировалась фигура «Медвежий симметричный треугольник». Торговые рекомендации: Пробой нижней границы 0.4989 с большой долей вероятности приведет к продолжению нисходящего тренда.

Таймфреймы М5 и М15 могут иметь больше ложных точек входа.

Фигура
  • Все
  • Вымпел
  • Голова и плечи
  • Двойная вершина
  • Прямоугольник
  • Треугольник
  • Тройная вершина
  • Флаг
Инструмент
  • Все
  • #AAPL
  • #AMZN
  • #Bitcoin
  • #EBAY
  • #FB
  • #GOOG
  • #INTC
  • #KO
  • #MA
  • #MCD
  • #MSFT
  • #NTDOY
  • #PEP
  • #TSLA
  • #TWTR
  • AUDCAD
  • AUDCHF
  • AUDJPY
  • AUDUSD
  • EURCAD
  • EURCHF
  • EURGBP
  • EURJPY
  • EURNZD
  • EURRUB
  • EURUSD
  • GBPAUD
  • GBPCHF
  • GBPJPY
  • GBPUSD
  • GOLD
  • NZDCAD
  • NZDCHF
  • NZDJPY
  • NZDUSD
  • SILVER
  • USDCAD
  • USDCHF
  • USDJPY
  • USDRUB
Таймфрейм
  • Все
  • M5
  • M15
  • M30
  • H1
  • D1
Тренд
  • Все
  • Покупка
  • Продажа
Сила сигнала
  • Все
  • 1
  • 2
  • 3
  • 4
  • 5
Double Bottom
was formed on 25.04 at 20:55:55 (UTC+0)
signal strength 1 of 5
Double Bottom GBPCHF M5

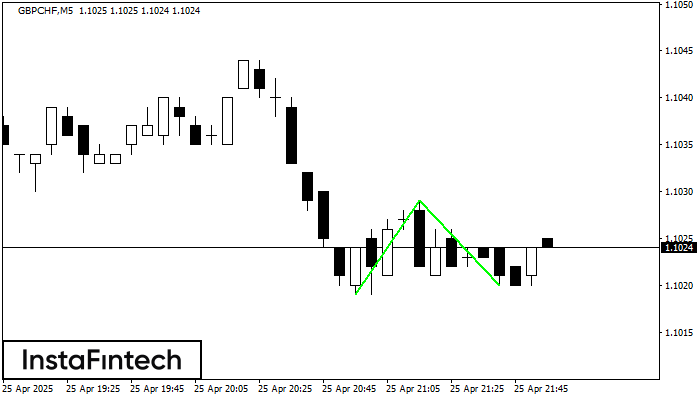
The Double Bottom pattern has been formed on GBPCHF M5. This formation signals a reversal of the trend from downwards to upwards. The signal is that a buy trade should

The M5 and M15 time frames may have more false entry points.

Open chart in a new window
Bullish Symmetrical Triangle
was formed on 25.04 at 20:26:21 (UTC+0)
signal strength 1 of 5
Bullish Symmetrical Triangle GBPUSD M5

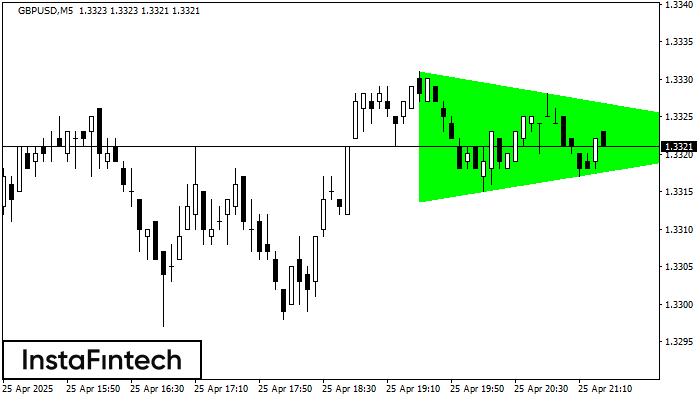
According to the chart of M5, GBPUSD formed the Bullish Symmetrical Triangle pattern, which signals the trend will continue. Description. The upper border of the pattern touches the coordinates 1.3331/1.3322

The M5 and M15 time frames may have more false entry points.

Open chart in a new window
Double Bottom
was formed on 25.04 at 20:20:19 (UTC+0)
signal strength 1 of 5
Double Bottom #MCD M5

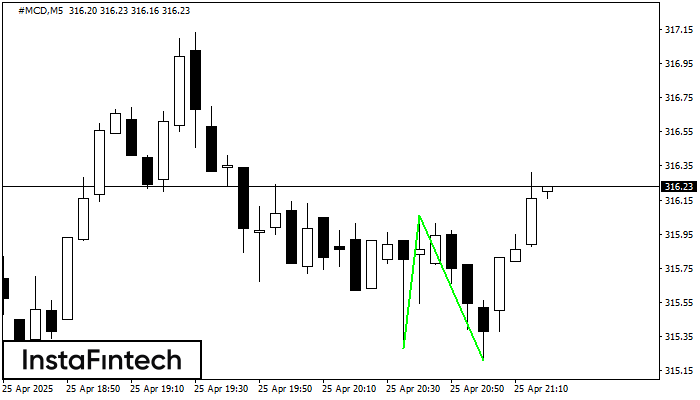
The Double Bottom pattern has been formed on #MCD M5; the upper boundary is 316.06; the lower boundary is 315.21. The width of the pattern is 78 points. In case

The M5 and M15 time frames may have more false entry points.

Open chart in a new window
Hozir telefon orqali gaplasha olmaysizmi?
Savolingizni bering chatda.
Обратный звонок
 

Dear visitor,

Your IP address shows that you are currently located in the USA. If you are a resident of the United States, you are prohibited from using the services of InstaFintech Group including online trading, online transfers, deposit/withdrawal of funds, etc.

If you think you are seeing this message by mistake and your location is not the US, kindly proceed to the website. Otherwise, you must leave the website in order to comply with government restrictions.

Why does your IP address show your location as the USA?

  • - you are using a VPN provided by a hosting company based in the United States;
  • - your IP does not have proper WHOIS records;
  • - an error occurred in the WHOIS geolocation database.

Please confirm whether you are a US resident or not by clicking the relevant button below. If you choose the wrong option, being a US resident, you will not be able to open an account with InstaForex anyway.

We are sorry for any inconvenience caused by this message.