empty
16.05.2022 10:29 AM
Tips for beginner traders in EUR/USD and GBP/USD on May 16, 2022

Details of the economic calendar from May 13

EU industrial production data showed a decline of 0.8%, with a forecast of -1.0%. Despite a slight discrepancy in indicators, the European currency remained under pressure due to the fact that previous indicators were revised for the worse.

Analysis of trading charts from May 13

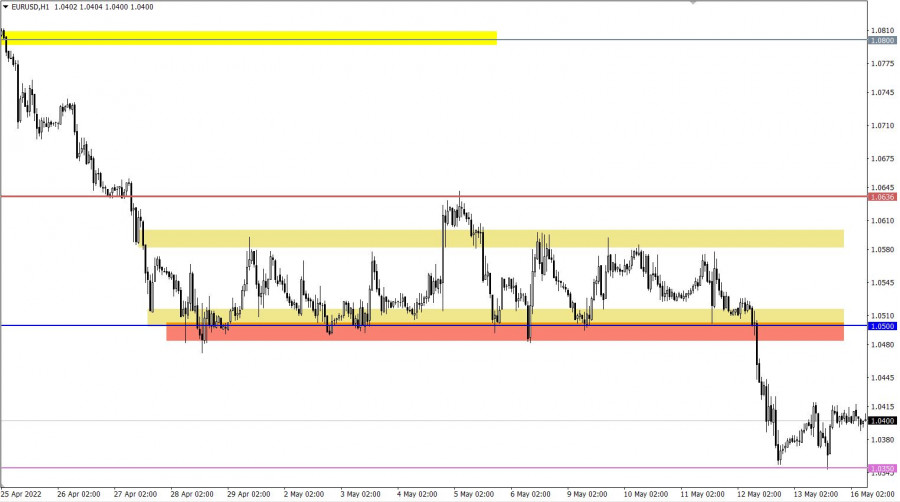
The EURUSD currency pair slowed down the downward move after the price approached the 2016 bottom. This led to a reduction in the volume of short positions and, as a result, a pullback of about 70 points.

On the trading chart of the daily period, there is an attempt to prolong the downward trend. In the future, this movement may lead to a breakdown of parity.

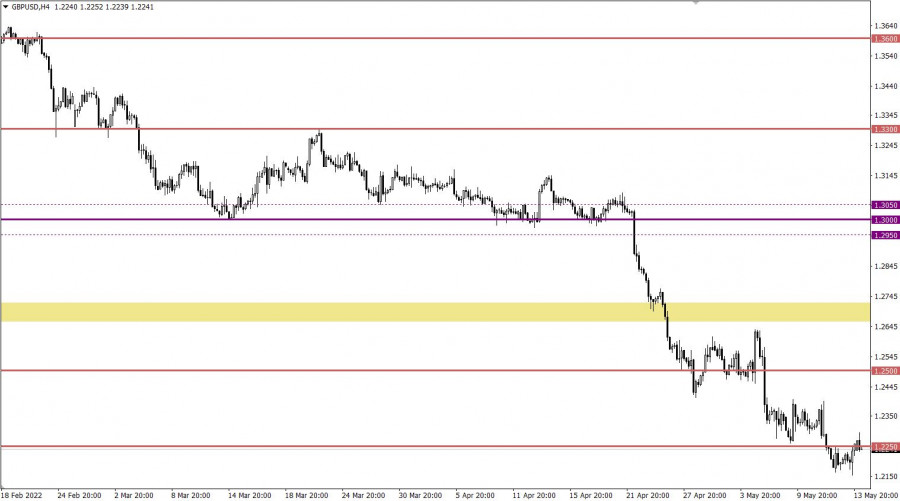
The GBPUSD currency pair, in the stage of a pullback from the variable pivot point of 1.2155, returned to the area of the level of 1.2250, where there was a slowdown. This step indicates the desire of sellers to resume the decline.

On the trading chart of the daily period, a gradual prolongation of the medium-term downward trend is observed.

This image is no longer relevant

Economic calendar for May 16

Monday is traditionally accompanied by a blank macroeconomic calendar. Nevertheless, stable information and news flow will continue to play on the nerves of speculators, which allows new jumps in the market.

Trading plan for EUR/USD on May 16

In this situation, the pullback was replaced by stagnation, where the values of 1.0350/1.0420 serve as variable boundaries of the amplitude. The optimal trading strategy is considered to be a breakdown of one or another stagnation border.

We concretize the above into trading signals:

Buy positions on the currency pair are taken into account after holding the price above the value of 1.0450 with the prospect of a move to 1.0500.

Sell positions should be considered after keeping the price below the local low of 2016, at 1.0325.

This image is no longer relevant

Trading plan for GBP/USD on May 16

Despite the slowdown, the pullback stage is still relevant in the market. In order for the downward cycle to resume, the quote must first return to the pivot point of 1.2150. This price move will indicate an increase in the volume of short positions, which will lead to the breakdown of the variable support and the trend prolongation.

An alternative market development scenario considers the price transition from the pullback stage to a full-scale correction. This movement can be indicated by a long stay of the price above 1.2250 in the daily period.

This image is no longer relevant

What is reflected in the trading charts?

A candlestick chart view is graphical rectangles of white and black light, with sticks on top and bottom. When analyzing each candle in detail, you will see its characteristics of a relative period: the opening price, closing price, and maximum and minimum prices.

Horizontal levels are price coordinates, relative to which a stop or a price reversal may occur. These levels are called support and resistance in the market.

Circles and rectangles are highlighted examples where the price of the story unfolded. This color selection indicates horizontal lines that may put pressure on the quote in the future.

The up/down arrows are the reference points of the possible price direction in the future.

Gven Podolsky,
Chuyên gia phân tích của InstaForex
© 2007-2025
Chọn khung thời gian
5
phút
15
phút
30
phút
1
giờ
4
ngày
1
ngày
1
tuần
Kiếm lợi nhuận từ những biến đổi giá của tiền điện tử với InstaForex.
Tải MetaTrader 4 và mở giao dịch đầu tiên của bạn.
  • Grand Choice
    Contest by
    InstaForex
    InstaForex always strives to help you
    fulfill your biggest dreams.
    THAM GIA CUỘC THI

Các bài báo được đề xuất

Làm thế nào để giao dịch cặp GBP/USD vào ngày 31 tháng 3? Mẹo đơn giản và phân tích giao dịch cho người mới bắt đầu

Cặp GBP/USD giao dịch đi ngang vào thứ Sáu, không giống như cặp EUR/USD. Và điều đó khá kỳ lạ. Trong vài tuần qua, đồng bảng Anh di chuyển trong

Paolo Greco 03:21 2025-03-31 UTC+2

Cách giao dịch cặp EUR/USD vào ngày 31 tháng 3? Mẹo đơn giản và phân tích giao dịch cho người mới bắt đầu

Vào thứ Sáu, cặp tiền tệ EUR/USD một lần nữa giao dịch tăng cao hơn. Không thể nói rằng các sự kiện kinh tế vĩ mô đã biện minh

Paolo Greco 03:21 2025-03-31 UTC+2

GBP/USD: Kế Hoạch Giao Dịch Phiên Mỹ Ngày 28 Tháng Ba (Đánh Giá Giao Dịch Buổi Sáng)

Trong dự báo buổi sáng của tôi, tôi tập trung vào mức 1.2964 và lên kế hoạch đưa ra quyết định tham gia thị trường dựa trên

Miroslaw Bawulski 18:54 2025-03-28 UTC+2

EUR/USD: Kế hoạch giao dịch cho phiên Mỹ vào ngày 28 tháng 3 (Đánh giá giao dịch buổi sáng)

Trong dự báo buổi sáng của tôi, tôi đã nhấn mạnh mức 1.0801 và lên kế hoạch dựa vào nó để thực hiện các lệnh giao dịch. Hãy nhìn

Miroslaw Bawulski 18:52 2025-03-28 UTC+2

Cách giao dịch cặp GBP/USD vào ngày 28 tháng 3? Mẹo đơn giản và phân tích giao dịch cho người mới bắt đầu

Vào thứ Năm, cặp tỷ giá GBP/USD cũng giao dịch tăng và khá mạnh. Mặc dù báo cáo GDP quý 4 của Hoa Kỳ khá tốt được công bố, nhưng

Paolo Greco 06:05 2025-03-28 UTC+2

Cách giao dịch cặp EUR/USD vào ngày 28 tháng 3? Mẹo đơn giản và phân tích giao dịch cho người mới bắt đầu

Cặp tiền tệ EUR/USD đã tăng lên mức 1.0804 vào thứ Năm. Tự nhiên, một sự tăng mạnh và bất ngờ của đồng euro (hoặc chính

Paolo Greco 06:05 2025-03-28 UTC+2

Khuyến nghị và Phân tích giao dịch cho GBP/USD ngày 28 tháng 3: Đồng bảng Anh tiếp tục dao động

Cặp tiền tệ GBP/USD đã cho thấy một sự chuyển động mạnh mẽ lên cao vào thứ Năm. Tự nhiên, một lần nữa, tác nhân chính là Donald Trump, người

Paolo Greco 02:47 2025-03-28 UTC+2

Khuyến nghị và Phân tích Giao dịch cho EUR/USD vào ngày 28 tháng 3: Thuế quan của Trump và GDP

Vào thứ Năm, cặp tiền tệ EUR/USD tăng mạnh mà không phá vỡ xu hướng giảm kéo dài trong vài ngày gần đây. Có những lý do xác đáng khiến

Paolo Greco 02:47 2025-03-28 UTC+2

GBP/USD: Kế Hoạch Giao Dịch cho Phiên Hoa Kỳ ngày 27 tháng 3 (Đánh Giá Giao Dịch Buổi Sáng)

Trong dự báo buổi sáng của tôi, tôi đã tập trung vào mức 1.2916 và lập kế hoạch đưa ra quyết định giao dịch dựa trên

Miroslaw Bawulski 17:56 2025-03-27 UTC+2

EUR/USD: Kế Hoạch Giao Dịch Cho Phiên Mỹ Ngày 27 Tháng 3 (Đánh Giá Các Giao Dịch Buổi Sáng)

Trong dự báo buổi sáng, tôi tập trung vào mức 1.0769 và lên kế hoạch thực hiện quyết định giao dịch dựa trên mức này. Hãy xem biểu

Miroslaw Bawulski 17:53 2025-03-27 UTC+2
Không thể nói chuyện ngay bây giờ?
Đặt câu hỏi của bạn trong phần trò chuyện.
Widget callback
 

Dear visitor,

Your IP address shows that you are currently located in the USA. If you are a resident of the United States, you are prohibited from using the services of InstaFintech Group including online trading, online transfers, deposit/withdrawal of funds, etc.

If you think you are seeing this message by mistake and your location is not the US, kindly proceed to the website. Otherwise, you must leave the website in order to comply with government restrictions.

Why does your IP address show your location as the USA?

  • - you are using a VPN provided by a hosting company based in the United States;
  • - your IP does not have proper WHOIS records;
  • - an error occurred in the WHOIS geolocation database.

Please confirm whether you are a US resident or not by clicking the relevant button below. If you choose the wrong option, being a US resident, you will not be able to open an account with InstaForex anyway.

We are sorry for any inconvenience caused by this message.