empty
was formed on 21.03 at 19:22:58 (UTC+0)
signal strength 1 of 5
Bullish Flag #INTC M5

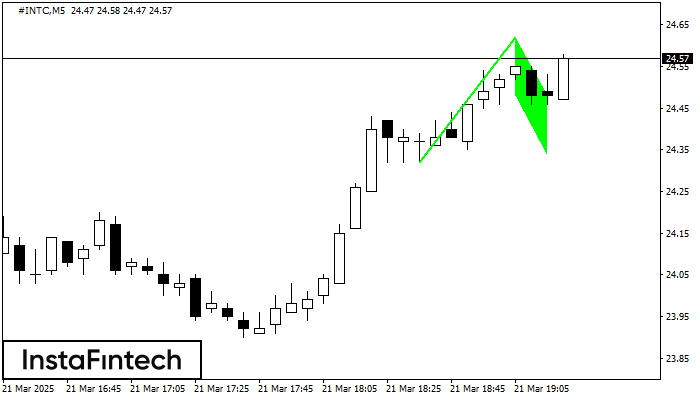
The Bullish Flag pattern has been formed on the chart #INTC M5 which signals that the upward trend will continue. Signals: а break of the peak at 24.62 may push the price higher, and the rise will be the projection of the pole.

The M5 and M15 time frames may have more false entry points.

Xem thêm

Figure
  • All
  • Double Top
  • Flag
  • Head and Shoulders
  • Pennant
  • Rectangle
  • Triangle
  • Triple top
Instrument
  • All
  • #AAPL
  • #AMZN
  • #Bitcoin
  • #EBAY
  • #FB
  • #GOOG
  • #INTC
  • #KO
  • #MA
  • #MCD
  • #MSFT
  • #NTDOY
  • #PEP
  • #TSLA
  • #TWTR
  • AUDCAD
  • AUDCHF
  • AUDJPY
  • AUDUSD
  • EURCAD
  • EURCHF
  • EURGBP
  • EURJPY
  • EURNZD
  • EURRUB
  • EURUSD
  • GBPAUD
  • GBPCHF
  • GBPJPY
  • GBPUSD
  • GOLD
  • NZDCAD
  • NZDCHF
  • NZDJPY
  • NZDUSD
  • SILVER
  • USDCAD
  • USDCHF
  • USDJPY
  • USDRUB
Timeframe
  • All
  • M5
  • M15
  • M30
  • H1
  • D1
Trend
  • All
  • Buy
  • Sale
Signal Strength
  • All
  • 1
  • 2
  • 3
  • 4
  • 5
Bearish Symmetrical Triangle
was formed on 28.03 at 13:02:25 (UTC+0)
signal strength 2 of 5
Bearish Symmetrical Triangle NZDUSD M15

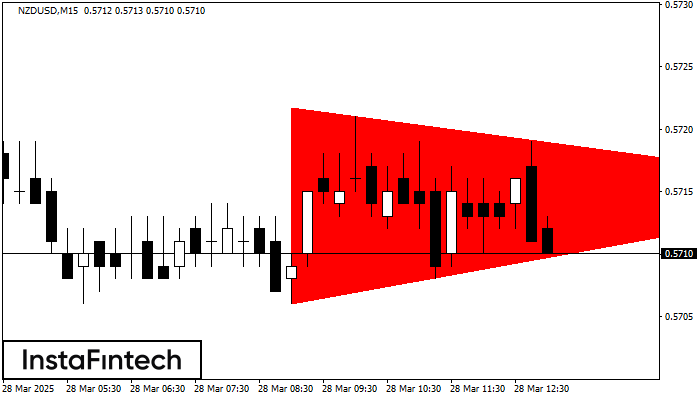
According to the chart of M15, NZDUSD formed the Bearish Symmetrical Triangle pattern. This pattern signals a further downward trend in case the lower border 0.5706 is breached. Here

The M5 and M15 time frames may have more false entry points.

Open chart in a new window
Head and Shoulders
was formed on 28.03 at 12:14:49 (UTC+0)
signal strength 2 of 5
Head and Shoulders EURCAD M15

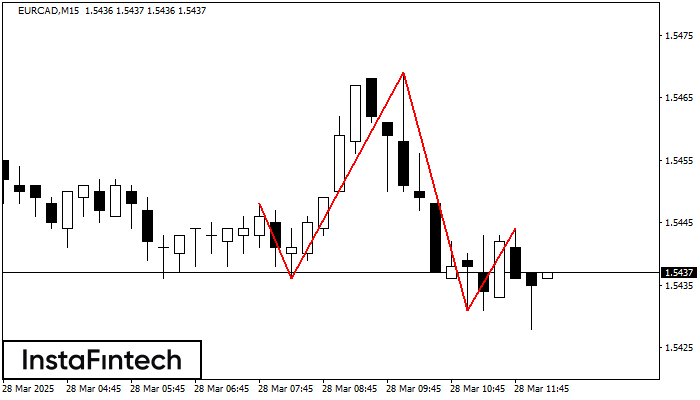
The technical pattern called Head and Shoulders has appeared on the chart of EURCAD M15. There are weighty reasons to suggest that the price will surpass the Neckline 1.5436/1.5431 after

The M5 and M15 time frames may have more false entry points.

Open chart in a new window
Double Bottom
was formed on 28.03 at 12:09:57 (UTC+0)
signal strength 1 of 5
Double Bottom #Bitcoin M5

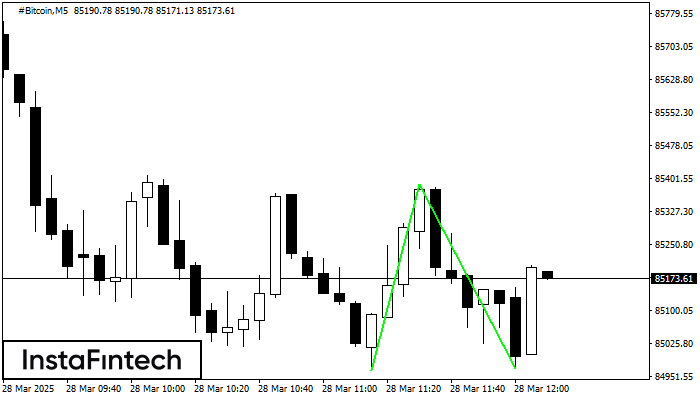
The Double Bottom pattern has been formed on #Bitcoin M5; the upper boundary is 85387.82; the lower boundary is 84969.24. The width of the pattern is 42309 points. In case

The M5 and M15 time frames may have more false entry points.

Open chart in a new window
Không thể nói chuyện ngay bây giờ?
Đặt câu hỏi của bạn trong phần trò chuyện.
Widget callback
 

Dear visitor,

Your IP address shows that you are currently located in the USA. If you are a resident of the United States, you are prohibited from using the services of InstaFintech Group including online trading, online transfers, deposit/withdrawal of funds, etc.

If you think you are seeing this message by mistake and your location is not the US, kindly proceed to the website. Otherwise, you must leave the website in order to comply with government restrictions.

Why does your IP address show your location as the USA?

  • - you are using a VPN provided by a hosting company based in the United States;
  • - your IP does not have proper WHOIS records;
  • - an error occurred in the WHOIS geolocation database.

Please confirm whether you are a US resident or not by clicking the relevant button below. If you choose the wrong option, being a US resident, you will not be able to open an account with InstaForex anyway.

We are sorry for any inconvenience caused by this message.