signal strength 4 of 5

According to the chart of H1, EURUSD formed the Bullish Symmetrical Triangle pattern, which signals the trend will continue. Description. The upper border of the pattern touches the coordinates 1.0849/1.0814 whereas the lower border goes across 1.0777/1.0814. The pattern width is measured on the chart at 72 pips. If the Bullish Symmetrical Triangle pattern is in progress during the upward trend, this indicates the current trend will go on. In case 1.0814 is broken, the price could continue its move toward 1.0854.
Xem thêm
- All
- Double Top
- Flag
- Head and Shoulders
- Pennant
- Rectangle
- Triangle
- Triple top
- All
- #AAPL
- #AMZN
- #Bitcoin
- #EBAY
- #FB
- #GOOG
- #INTC
- #KO
- #MA
- #MCD
- #MSFT
- #NTDOY
- #PEP
- #TSLA
- #TWTR
- AUDCAD
- AUDCHF
- AUDJPY
- AUDUSD
- EURCAD
- EURCHF
- EURGBP
- EURJPY
- EURNZD
- EURRUB
- EURUSD
- GBPAUD
- GBPCHF
- GBPJPY
- GBPUSD
- GOLD
- NZDCAD
- NZDCHF
- NZDJPY
- NZDUSD
- SILVER
- USDCAD
- USDCHF
- USDJPY
- USDRUB
- All
- M5
- M15
- M30
- H1
- D1
- All
- Buy
- Sale
- All
- 1
- 2
- 3
- 4
- 5
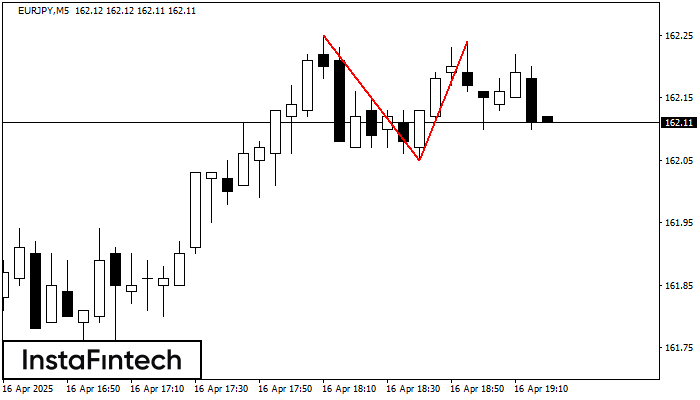
No gráfico de EURJPY M5 o padrão de reversão Topo duplo foi formado. Características: o limite superior 162.24; o limite inferior 162.05; a largura do padrão 19 pontos. O sinal
Os intervalos M5 e M15 podem ter mais pontos de entrada falsos.
Open chart in a new window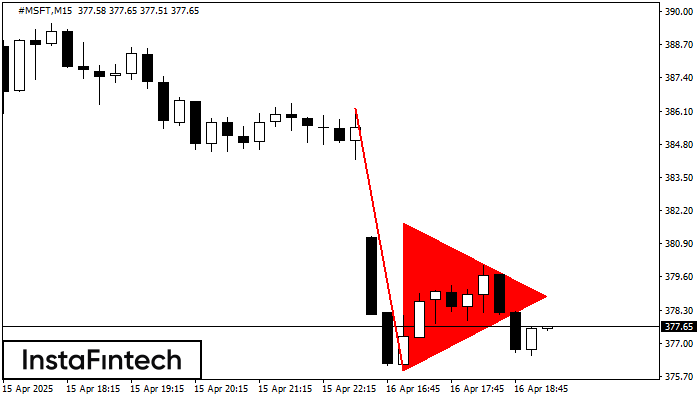
O padrão Pennant de baixa foi formado no gráfico #MSFT M15. Este tipo de padrão é caracterizado por uma ligeira desaceleração após a qual o preço se moverá na direção
Os intervalos M5 e M15 podem ter mais pontos de entrada falsos.
Open chart in a new window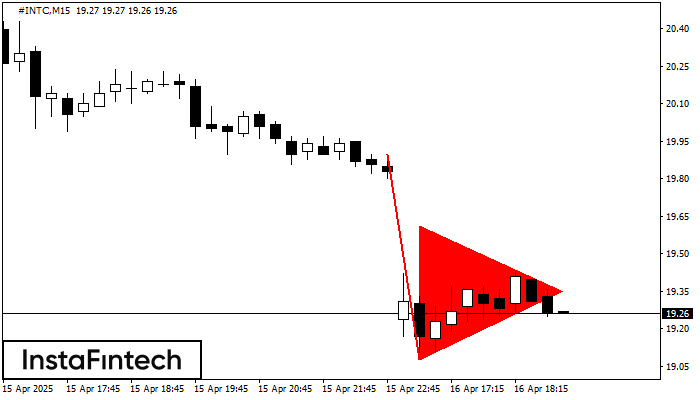
O padrão Pennant de baixa foi formado no gráfico #INTC M15. Ele sinaliza a continuação potencial da tendência existente. Especificações: o fundo do padrão tem a coordenada de 19.08;
Os intervalos M5 e M15 podem ter mais pontos de entrada falsos.
Open chart in a new window